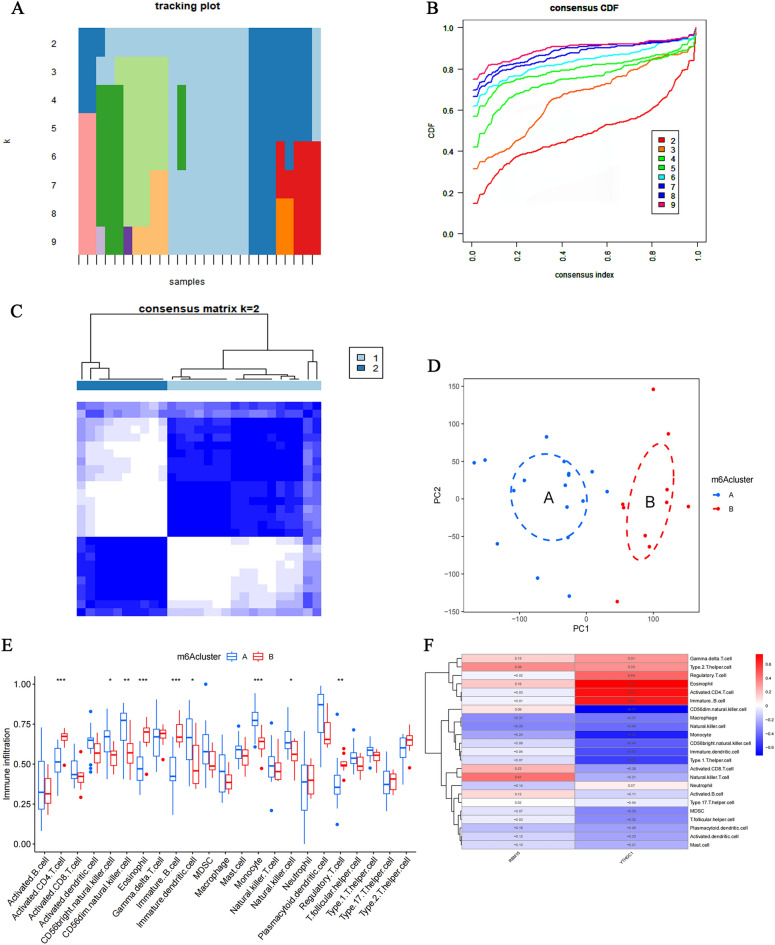
Figure 6.
Cluster analysis of IVDD patients based on RBM15, YTHDC1. (A,B) Eight sub-clusters of RBM15, YTHDC1 for IVDD patients. (C) Correlation of patients between groups when the consensus clustering matrix k = 2. (D) PCA analysis at optimal clustering. Groups A and B represent two categories of IVDD patients based on the expression of RBM15, YTHDC1. (E) Expression of 23 immune cells based on optimal clustering. (F) Heat map of the correlation between immune cell infiltration of RBM15, YTHDC1. Red indicates positive correlation, blue indicates negative correlation.

