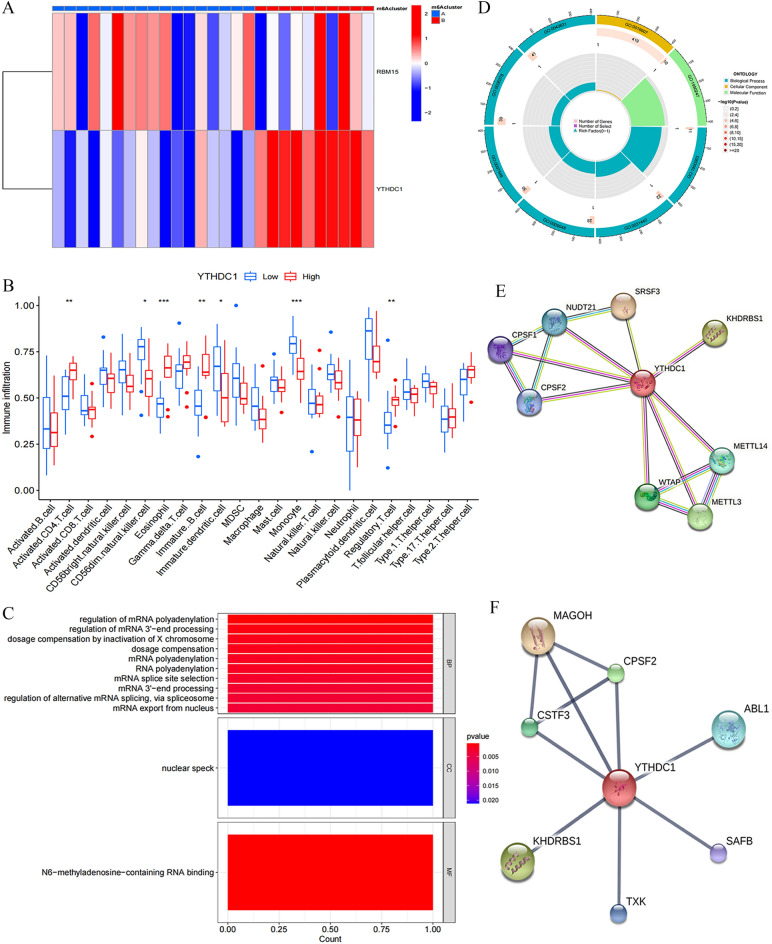
Figure 7.
Identification of IVDD biomarkers, immune micro-environment characterization, enrichment analysis, protein interaction network analysis and molecular prediction. (A) Heat map of expression of RBM15, YTHDC1 under two subclusters Red indicates positive correlation, blue indicates negative correlation. (B) Expression of 23 immune cells under YTHDC1-based expression grouping *P < 0.05, **P < 0.01, ***P < 0.001. (C,D) GO enrichment analysis of YTHDC1. (E) YTHDC1-based protein interactions network analysis. (F) Molecular prediction based on YTHDC1.

