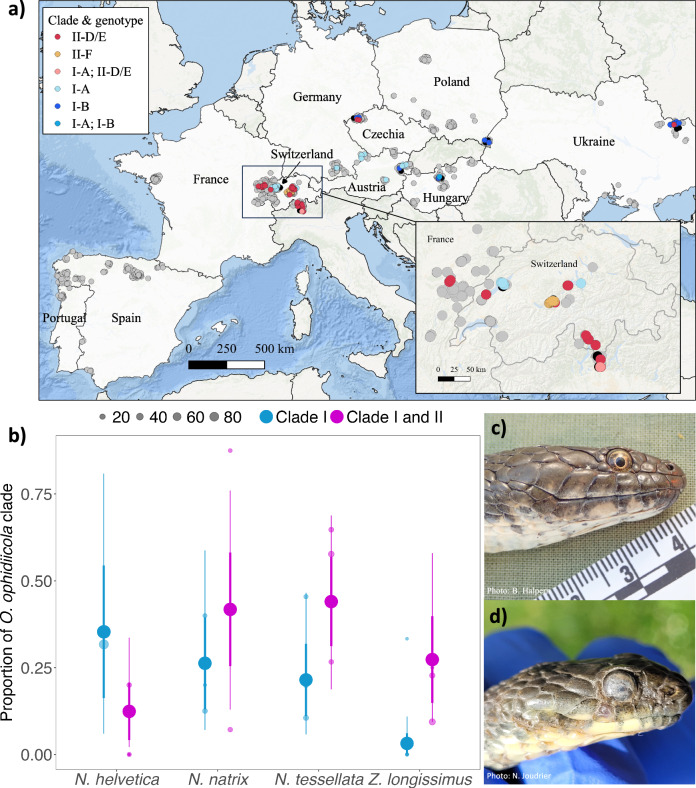
Fig. 4. Distribution of O. ophidiicola clades and genotypes across Europe.
a O. ophidiicola clades and genotypes from positive detections (n = 93) across the landscape in Europe. Points are slightly jittered for visual representation of the sampling range. Color of the point indicates the clades and genotypes, samples that were qPCR negative are represented as gray points (n = 1145), and samples that failed to amplify with the genotyping PCR are represented as black points (n = 16). Pink and medium blue points represent simultaneous detections of genotypes I-A and II-D/E and genotypes I-A and I-B, respectively, from the same swab sample (i.e., snakes infected with multiple genotypes). The enlarged map (inset) shows better resolution of detections in Switzerland. b The proportion of each O. ophidiicola clade (clade I or clade I & II) detected by species. Small color points are predicted mean prevalence at a site for a given species and clade, point size indicates sample size at each site. Large color points and whiskers show the model predicted posterior mean, ±standard deviation (thick lines), and 95% credible intervals (thin lines) across different species. c Photo of a N. tessellata from Hungary infected with O. ophidiicola from clade I-B. d Photo of a N. tessellata from Switzerland infected with O. ophidiicola from clade II-F showing facial infection.

