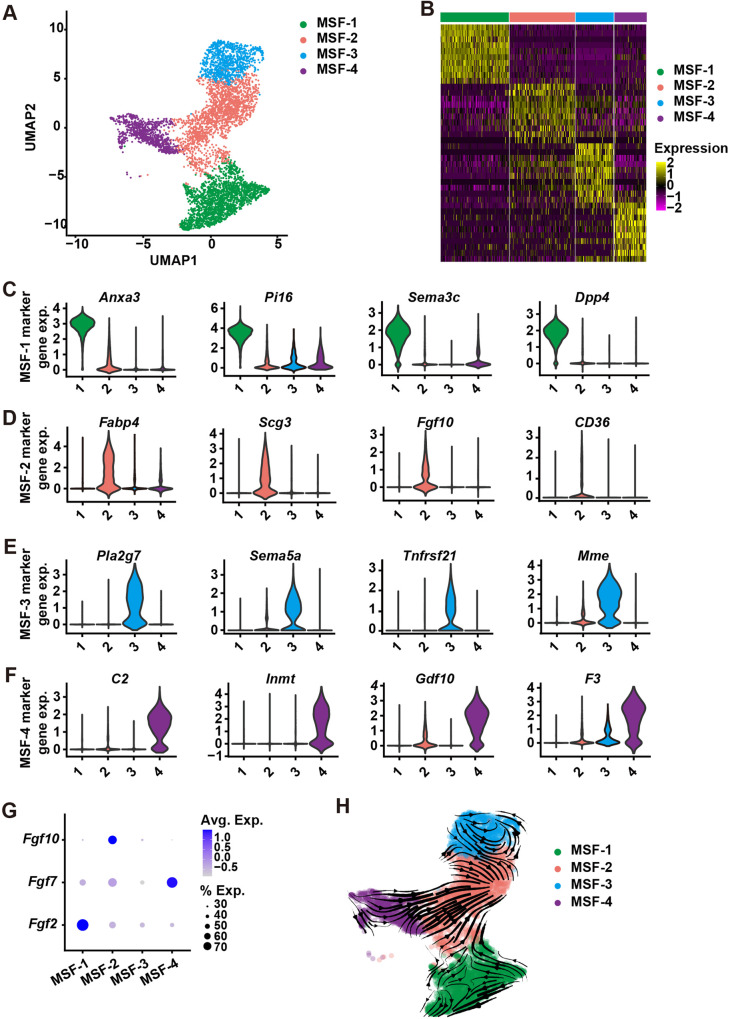
Fig. 4. MSF-2 subgroup is derived from three independent fibroblast lineages.
A t-SNE plot showing the single cell transcriptomics of mammary stromal fibroblasts from the control glands. B Heatmap showing relative log-expression of the top 10 marker genes for each cell cluster identified in Fig. 4A. Abbreviation: exp., expression. C–F mRNA expression of four representative genes from MSF-1 (C), MSF-2 (D), MSF-3 (E), and MSF-4 (F). G mRNA expression Fgf2, Fgf7, and Fgf10 in the MSF1-4 subgroups. Avg. Average, Exp. Expression. H Velocity analysis showing multiple origins of the MSF-2 population. Note that arrows indicate the differentiation directions.

