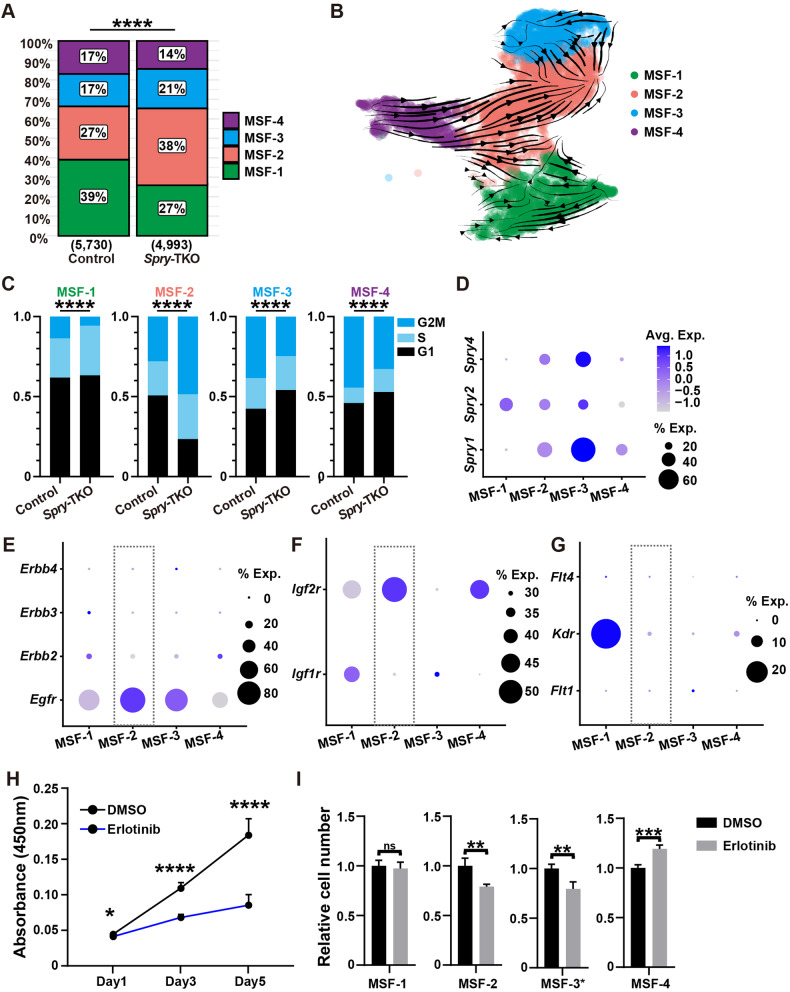
Fig. 5. Spry genes inhibit expansion of MSF-2 subpopulation.
A Size distribution of the MSF1-4 subgroups in the control and Spry-TKO mammary glands. Numbers in parenthesis indicate sample numbers. B Velocity analysis of MSFs in the Spry-TKO glands. Note that MSF-2 differentiation from other MSFs were largely the same as in the control gland (Fig. 4H). C Cell cycle analysis of cells in the MSF-1 to MSF-4 subgroups from the control and Spry-TKO mammary glands. P < 0.001****. Chi-squared test was used for statistical analysis. D Expression Spry1, Spry2, and Spry4 in MSF1-4 subgroups. E–G Expression of members of the Erbb (E), Igfr (F), and Vegfr (G) families. Rectangles with dashed lines emphasize RTKs that are expressed by MSF-2 cells. Note that the area of each circle correlates with the percentage of fibroblasts that express the target gene of interest, while changes of color intensity indicate the levels of increased or decreased mRNA expression as in (D). H, I Cell proliferation of total fibroblasts (H) or fibroblast subtypes (I) treated with medium containing the placebo control DMSO or the EGFR inhibitor Erlotinib. Data were from three independent experiments and were presented as mean ± SD. ns, not significant; *P < 0.05; **P < 0.01; ***P < 0.001, ****P < 0.0001.

