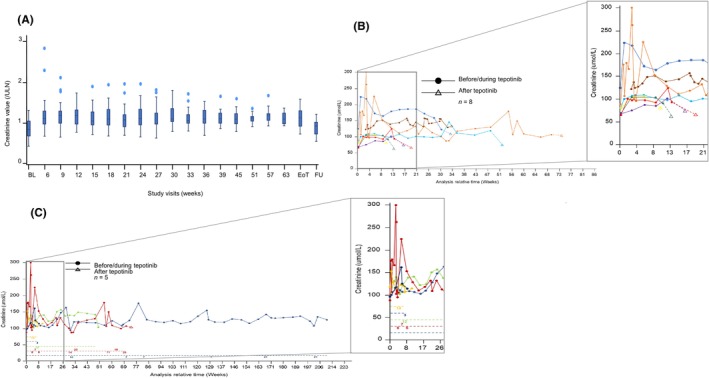
FIGURE 5.

Creatinine levels after initiating and discontinuation of tepotinib in Japanese patients. (A) Box plots* for creatinine values over time; (B) Line graph showing creatinine values before and after tepotinib in patients with post‐treatment data available; (C) Line graph showing creatinine value before and after tepotinib in patients who had treatment interruptions† due to blood creatinine increase. *Time points with data from 10 or fewer patients are not presented, with the exception of baseline, end of treatment and 30‐day safety follow‐up visits. †In (C), the positioning of numbers along the dashed line reflects the timings of treatment interruptions, with values corresponding to the number of interruption days at each instance. 1L, first line; 2L+, second‐or‐later line, EoT, end of treatment; FU, 30‐day safety follow‐up.
