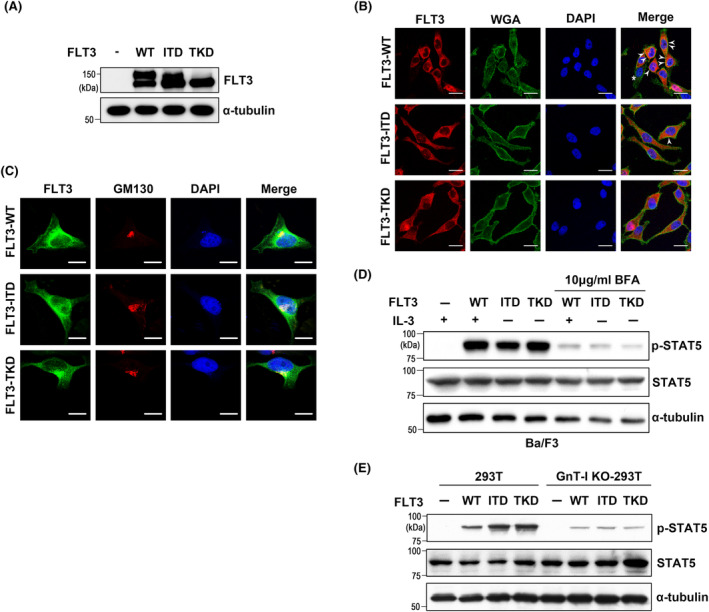
FIGURE 1.

Comparison of FLT3 localization among WT and mutants in HeLa cells, and effects of N‐glycosylation on cellular signaling. (A) Expression patterns of FLT3 in 293T cells. Expression of WT, ITD, or TKD was determined by western blotting with FLT3 antibody. (B) and (C) Representative images of immunofluorescent staining showed the expression and localization of WT, ITD, and TKD in HeLa cells, in which cell membrane and Golgi apparatus are more easily distinguishable due to the superior cell spread property compared to other cell types such as 293T and Ba/F3 cells. The white arrows indicate the cell surface area. The asterisk represents cells that were not successfully transfected. DAPI (blue) was used for nuclear staining. Bar represents 20 μm. (D) The levels of p‐STAT5 were analyzed by western blot in Ba/F3 cells treated with or without BFA. The Ba/F3‐FLT3‐WT cells, stably transfected, were cultured in the presence of 1 ng/mL IL‐3 as described in the Materials and methods section. FLT3‐ITD and TKD cells were not included in this culture. (E) Effects of GnT‐I‐KO on the levels of p‐STAT5 in 293T cells. The same amounts of cell lysates were blotted with indicated antibodies. α‐Tubulin was used as an internal control.
