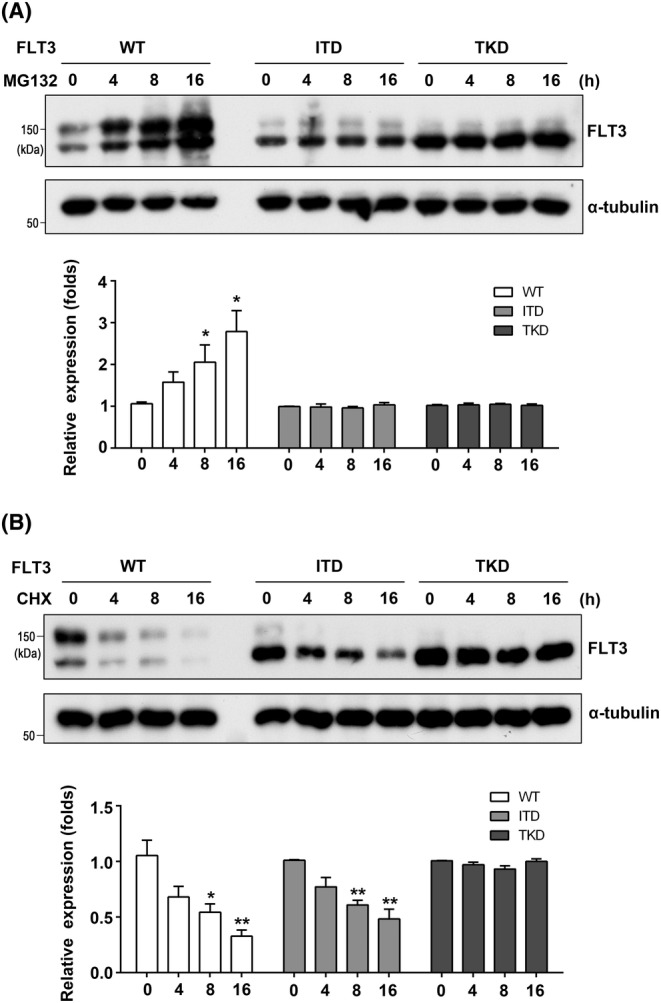
FIGURE 2.

Comparison of FLT3 stabilities among WT and mutants. 293 T cells were transfected with WT, ITD, or TKD and then treated with MG132 at 5 μM (A) or CHX at 50 μg/mL (B) for indicated times. The same amounts of cell lysates were blotted with indicated antibodies. The experiments were independently repeated three times. α‐Tubulin was used as an internal control. The relative expression levels of FLT3 were calculated by the intensities of FLT3 to that of α‐tubulin, which for cells without MG132 or CHX was set as 1.0. Data were analyzed by one‐way ANOVA and presented as the mean ± SD. *P < 0.05, **P < 0.01.
