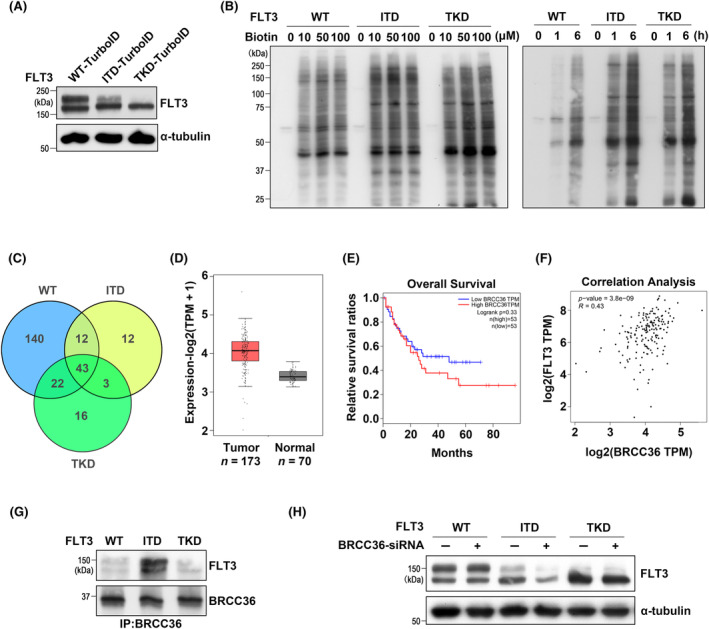
FIGURE 3.

Proximity labeling and identification of BRCC36. (A) Expression patterns of FLT3‐TurboID in 293T cells. Expression of WT‐, ITD‐, or TKD‐TurboID was determined by western blotting with FLT3 antibody. (B) Determination of suitable biotin concentration and labeling time in 293T cells expressing WT‐, ITD‐, or TKD‐TurboID. The same amounts of cell lysates were detected with the ABC kit. (C) Venn diagram showing the peptide distribution identified by MS in 293T cells expressing WT‐, ITD‐, or TKD‐TurboID. After biotinylation, the peptides were purified by the streptavidin‐coated magnetic beads as described in the Material and methods section. (D) Expression levels of BRCC36 in AML and normal tissues in the Gene Expression Profiling Interactive Analysis (GEPIA) database (n = 243). TPM, transcripts per million. (E) Survival plots of AML patients stratified by the BRCC36 levels using the GEPIA database (n = 106). The vertical lines represent censored data. (F) Correlation analysis between FLT3 and BRCC36 gene from the GEPIA database. (G) The immunoprecipitates (IP) with anti‐BRCC36 antibody were analyzed by western blot using an anti‐FLT3 antibody. (H) 293T cells were transfected with WT, ITD, or TKD plasmids with or without BRCC36‐siRNA. FLT3 stability was evaluated by western blot using an anti‐FLT3 antibody. α‐Tubulin was used as an internal control.
