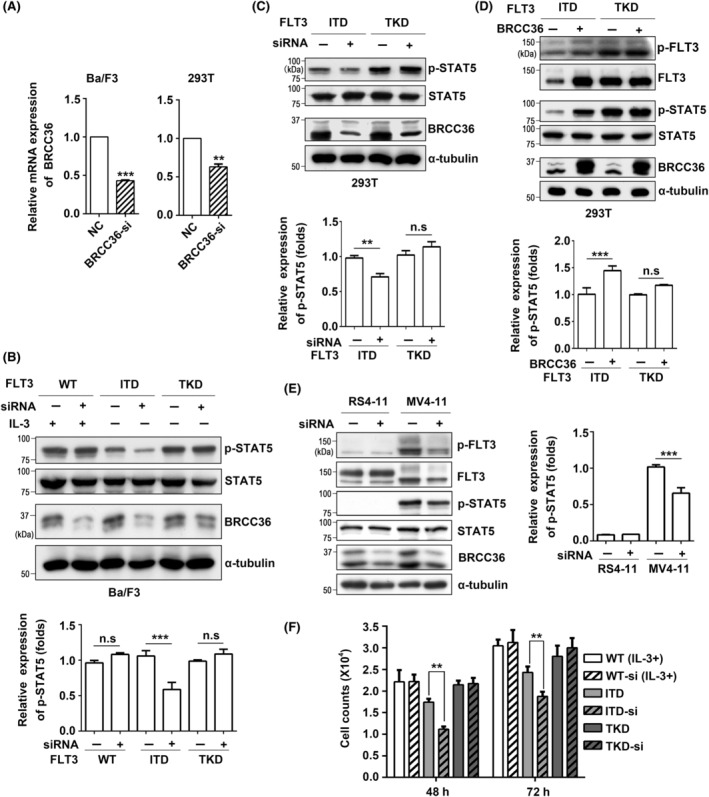
FIGURE 4.

The effects of BRCC36 on FLT3 expression and its mediated signaling. (A) Ba/F3 cells and 293T cells were transiently transfected with BRCC36‐siRNAs for 48 h, and then BRCC36 expression levels were detected by qPCR. Glyceraldehyde‐3‐phosphate dehydrogenase (GAPDH) was used as an internal control. After transfection with BRCC36‐siRNAs, the expression levels of p‐STAT5 and BRCC36 in Ba/F3 cells (B) or 293T cells (C) were detected by western blot using indicated antibodies. α‐Tubulin was used as an internal control. The relative expression levels of p‐STAT5 were calculated by the intensities of p‐STAT5 to that of STAT5, which for cells without transfection was set as 1.0. Data were analyzed by one‐way ANOVA and presented as the mean ± SD (n = 3). (D) After overexpression of BRCC36 in 293T cells, the expression levels of p‐FLT3, FLT3, p‐STAT5, and BRCC36 were detected by western blot. (E) After transfection with BRCC36‐siRNAs, the expression levels of p‐FLT3, FLT3, p‐STAT5, and BRCC36 in RS4‐11 (FLT3‐ITD negative) and MV4‐11 (FLT3‐ITD positive) cells were detected by western blot. The relative expression levels of p‐STAT5 were calculated by the intensities of p‐STAT5 to that of STAT5, which for MV4‐11 cells without transfection was set as 1.0. (F) Effects of BRCC36‐siRNA on cell proliferation in WT, ITD, and TKD Ba/F3 cells. The experiments were independently repeated three times. **P < 0.01, ***P < 0.001.
