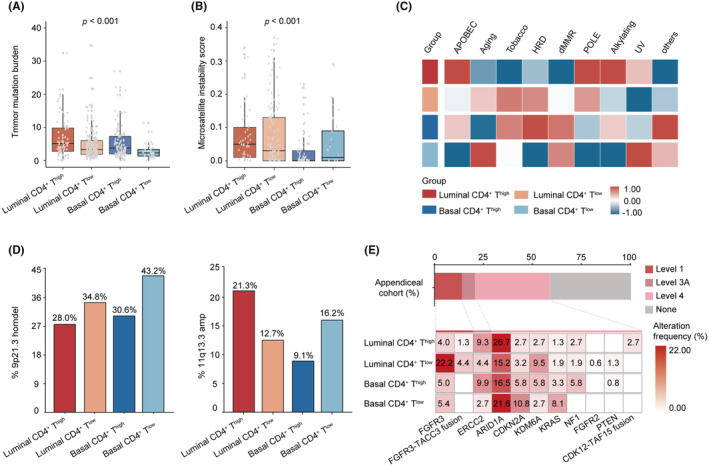
FIGURE 3.

Genomic characteristics of MIBC stratified by CD4+ T cells and molecular subtypes. (A) The distribution of TMB among four subgroups based on CD4+ T cells and molecular subtypes in TCGA cohort. (B) The distribution of MSI among four subgroups based on CD4+ T cells and molecular subtypes in TCGA cohort. (C) Heatmap for mutational signatures in TCGA cohort. (D) Prevalence of 9p21.3 homdel (left) and 11q13.3 amp (right) in four subgroups based on CD4+ T cells and molecular subtypes in TCGA cohort. (E) Highest levels of therapeutic actionability in MIBC stratified by CD4+ T cell infiltration and molecular subtypes in TCGA cohort. Data were analyzed by the Mann–Whitney U test and Pearson's chi‐square test. MIBC, muscle‐invasive bladder cancer; MSI, microsatellite instability score; TMB, tumor mutation burden.
