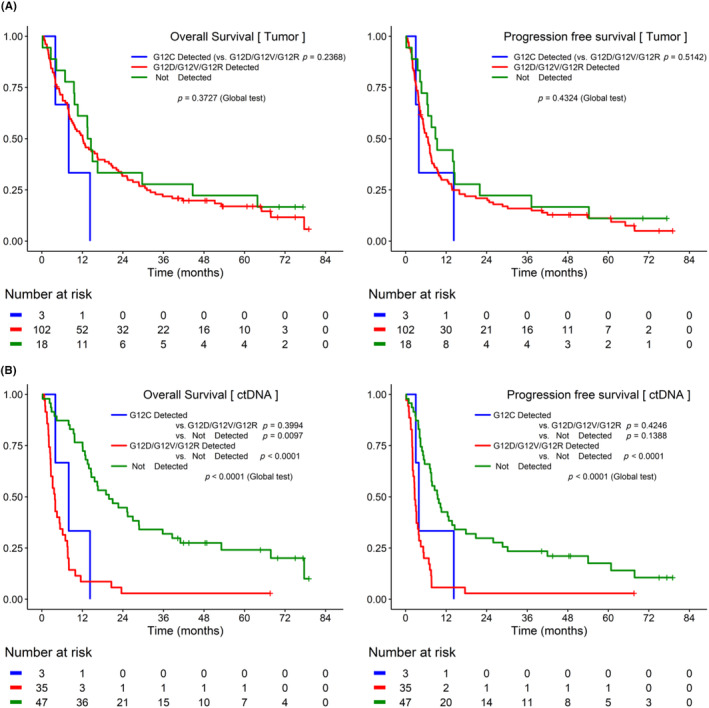
FIGURE 2.

Kaplan–Meier curves of progression‐free survival (PFS) and overall survival (OS) based on KRAS G12C detected in tumor DNA and circulating tumor DNA (ctDNA). (A) In tumor DNA, the difference in survival between the KRAS G12C‐detected group, the other hotspot (KRAS G12D/G12V/G12R)‐detected group, and the nondetected group was analyzed. There was no difference between the groups in tumor DNA. (B) In ctDNA, the KRAS G12C‐detected group showed significantly lower survival rates than the nondetected group.
