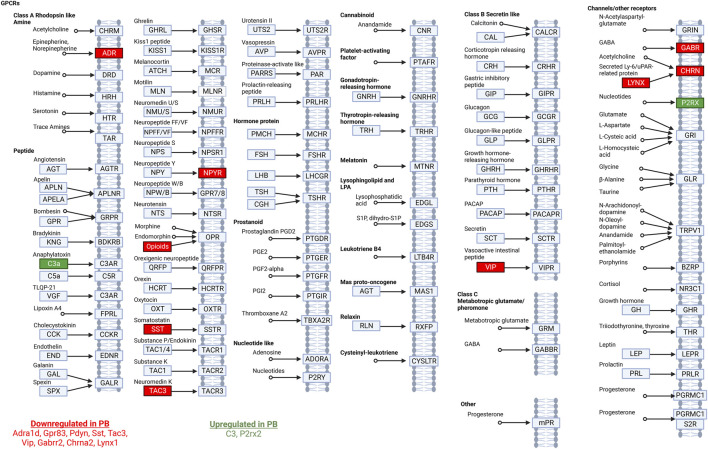
FIGURE 3.
Neuroactive ligand-receptor interaction pathway analysis. Modified from the Kyoto Encyclopedia of Genes and Genomes ligand-receptor interaction pathway. Significantly DEGs in this pathway in animals treated with PB are listed at the bottom of the figure. Downregulated transcripts are shown in red and upregulated transcripts are shown in green.

