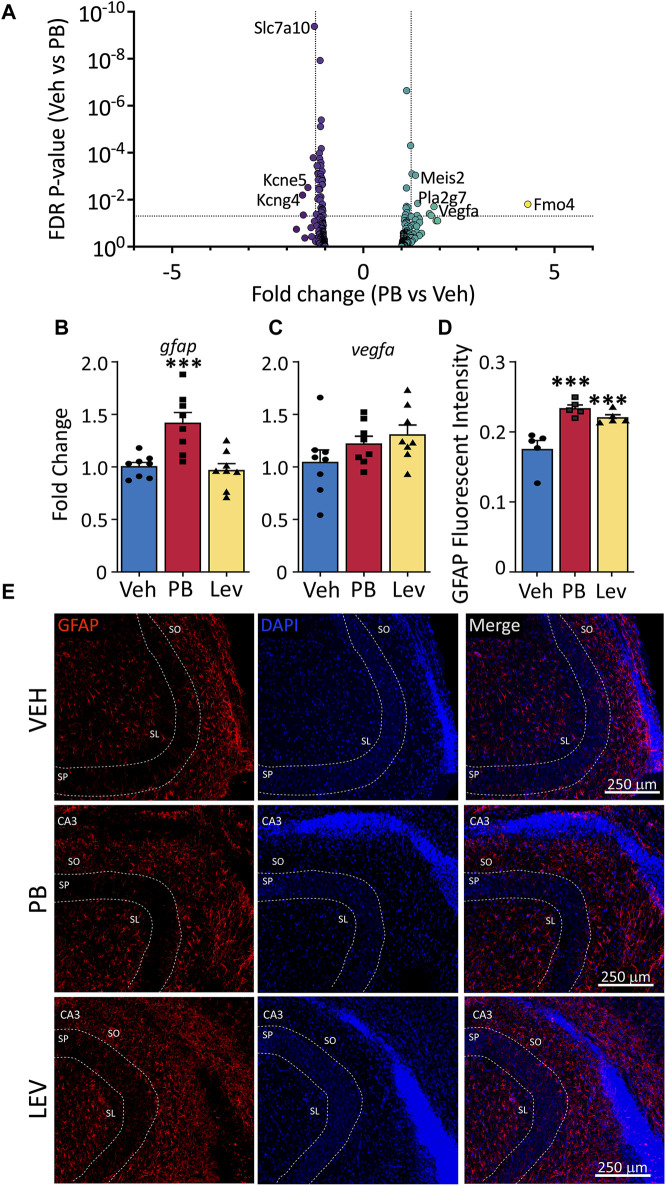
FIGURE 6.
Altered astrocytic marker expression following ASM treatment. (A) Volcano plots of astrocyte associated genes. Transcripts of vegfa were found increased in both PB and LEV treated animals. (B) qPCR for gfap showed that it was increased in PB treated (One Way ANOVA p-value = 0.0003, F2, 21 = 12.15, adj. p-value = 0.001) but not in LEV treated animals. While vegfa (C) mRNA levels were unchanged in both treatment groups (One Way ANOVA p-value = 0.163, F2, 21 = 1.978). (D,E) Representative photomicrographs of GFAP (left column) and DAPI (middle column) staining in the CA3 in animals treated with vehicle (top row), PB (middle row) and LEV (bottom row). Fluorescent intensity analysis showed that animals treated with both PB and LEV have increased levels of GFAP+ cells when compared with vehicle treated animals (One Way ANOVA p-value = 0.0007, F2, 12 = 14.19, VEH vs. PB adj. p-value<0.001 and VEH vs. LEV adj. p-value<0.005). SP = stratum pyramidale, SO = stratum oriens, SL = stratum lacunosum-moleculare.

