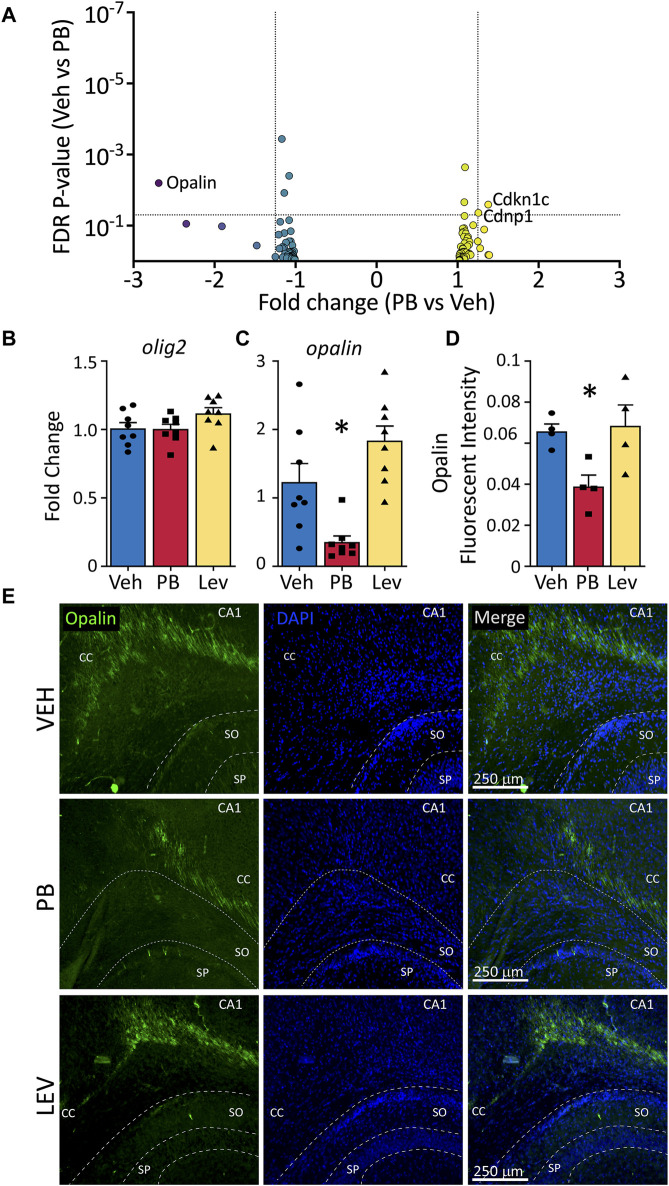
FIGURE 7.
Decreased opalin expression in PB treated animals. (A) Volcano plots of oligodendrocyte associated genes. (B) The mRNA levels of olig2 were unchanged in both PV and LEV treated animals when analyzed by qPCR (One Way ANOVA p-value = 0.4, F2, 33 = 0.94), however we observed a significant decrease in the levels of (C) opalin in PB treated animals when compared to vehicle (One Way ANOVA p-value = 0.0003, F2,21 = 12.51. adj. p-value = 0.02) (D,E) Representative photomicrographs of opalin (left column) and DAPI (middle column) staining in the corpus collosum in animals treated with vehicle (top row), PB (middle row) and LEV (bottom row). Reduced levels of opalin+ fluorescent intensity in the CC of animals treated with PB when compared to vehicle (One Way ANOVA p-value = 0.0106, F2, 10 = 7.416, VEH vs. PB adj. p-value = 0.02 Holm-Sidak corrected). SP = stratum pyramidale of CA1, SO = stratum oriens of CA1. CC = corpus callosum.

