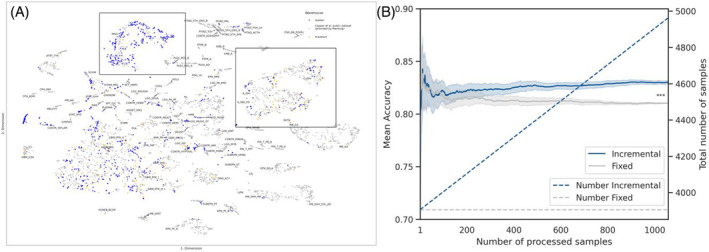
FIGURE 2.

DistSNE analysis of the collective data and accuracy measurements. (A) Distributed t‐SNE of the three locations Giessen (blue), Frankfurt (orange), and Marburg (Capper data) (grey). The clusters of IDH mutated gliomas (bottom) and of meningiomas (left lower) are marked with rectangles. (B) Accuracy of the fixed model (gray) and the incremental model (blue) for all gathered samples. The number of samples is visualized on the right y‐axis by the dotted lines for the fixed and incremental approach. Classification accuracy for all groups significantly improves with a higher sample number (incremental vs. fixed; p < 0.001, paired t‐test with Bonferroni correction).
