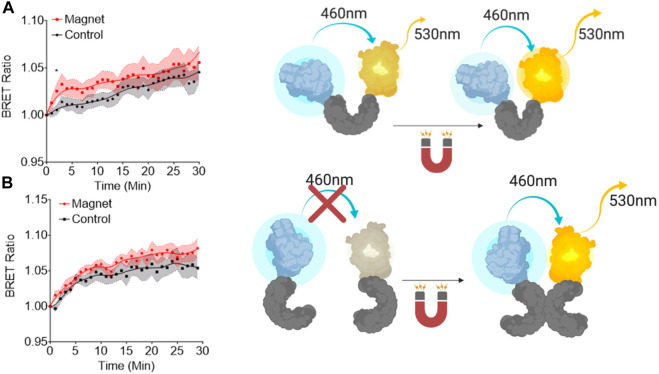
FIGURE 1.
Bioluminescent resonance energy transfer studies of EPG conformational changes. (A) A single copy of EPG (gray) cloned between NanoLuc (blue) and mVenus (yellow). (B) A copy of the EPG was fused to NanoLuc followed by an internal ribosome entry site (IRES) and an EPG fused to an mVenus to express both constructs on the same plasmid. Readings were taken at 530 nm and 460 nm every minute for 30 min with or without constant static magnetic stimulation. Readings were normalized to the last read before stimulation. Fit line in each graph is a lowess smoothing to show the relationship between the groups. Data are shown as mean ± S.E.M. N = 15 wells were analyzed for the single and N = 9 for the EPG IRES experiments. Statistical analysis was performed using an unpaired t-test with Welch’s correction at the saturation time point of each experiment (T = 2, A; T = 7, B). A (*) denotes a p-value <0.05.

