FIGURE 3.
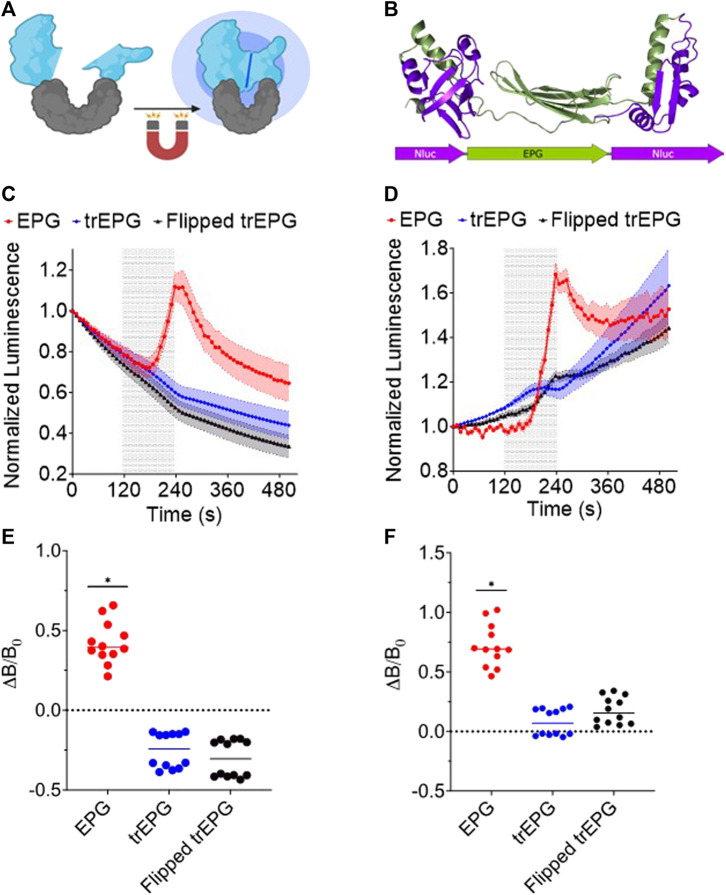
EPG split NanoLuc experiments in E. coli BL21 cells. Readings were taken on the IVIS every 10 s with an open filter. Electromagnetic stimulus was applied to the cells for 2 min and shown as a shaded region. (A) Illustration of the EPG split NanoLuc construct. (B) A model of the EPG split NanoLuc construct. E. coli lysate (C) and whole-cell E. coli (D) containing the EPG split NanoLuc (red) showed an increase in luminescence in contrast to EPG-truncated (Blue) and --flipped EPG (Black). Data are shown as mean ± S.E.M. Change in luminescence from before and after stimulus of each well in lysate (E) and whole-cell (F) groups is shown with a line at median. The results shown are duplicate experiments with N = 6 wells in each trial. Statistical significance was calculated using an unpaired t-test with Welch’s correction. A (*) denotes p-value <0.05.

