FIGURE 5.
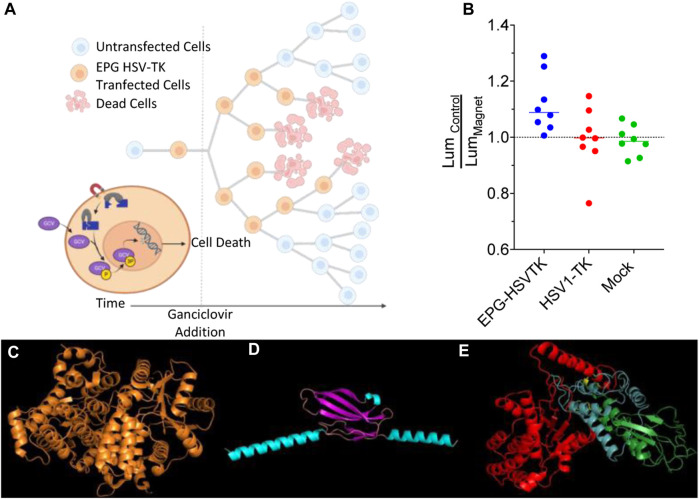
Ganciclovir-mediated cell death; control vs. magnet. (A) Schematic representation of the experimental process and design. (B) Ratio of average control cell luminescence to magnetic-stimulated cell luminescence over the course of eight experimental replicates. (C) Structure of HSV1-TK, (D) predicted structure of EPG with core structure (purple) and the signal sequence and membrane anchor sequence (teal), and (E) predicted structure of EPG split HSV1-TK with N-terminal HSV1-TK (red), EPG (green), and C-terminal HSV1-TK (blue).

