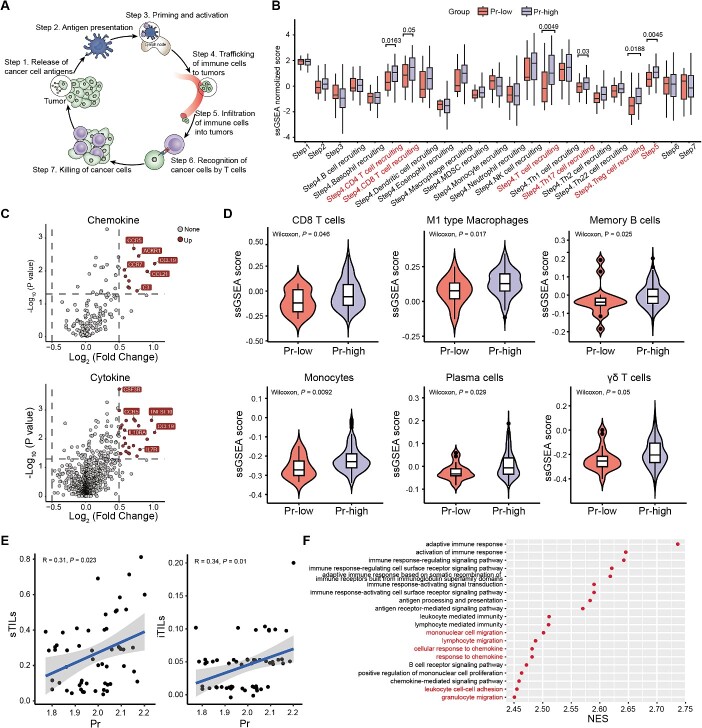
Figure 5.
Pr is positively correlated with the recruitment of immune cells in TNBCs. (A) Schematic view of a seven-step cancer-immune cycle, including release of cancer cell antigens, cancer antigen presentation by antigen presenting cells to immune cells, priming and activation of immune cells, trafficking of immune cells to tumors, infiltration of immune cells into tumors, recognition of cancer cells by T cells through TCR-antigen-MHC I, and killing of cancer cells. (B) The different levels of anticancer immunity across the seven-step cancer-immunity cycle in TNBCs with low and high Pr. Center line indicates the median value, lower and upper hinges represent the 25th and 75th percentiles, respectively, and whiskers represent 1.5 × interquartile range. Wilcoxon test P value was shown. (C) Volcano plots of enriched chemokines (upper) and cytokines (bottom) in TNBCs with high Pr compared with those with low Pr. (D) Single-sample GSEA scores of immune cell abundance were calculated and compared between the high- and low-Pr TNBC groups. Center line indicates the median value, lower and upper hinges represent the 25th and 75th percentiles, respectively, and whiskers represent 1.5 × interquartile range. Wilcoxon test P value was shown. (E) The correlation between TIL levels and Pr. (F) Cleveland plot showing the top 20 enriched pathways ordered by NES in the high Pr group. Abbreviations: Pr, promiscuity; TILs, tumor infiltrating lymphocytes; sTIL, stromal tumor infiltrating lymphocyte; iTIL, intratumoral tumor infiltrating lymphocyte; NES, normalized enrichment score; MHC, major histocompatibility complex; TCR, T cell receptor. See also Supplementary Figure 5.

