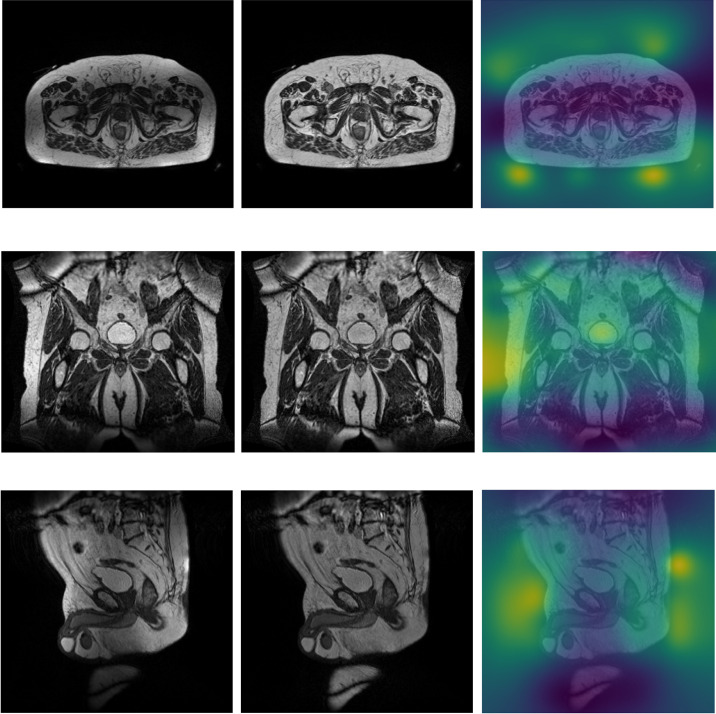
Figure 1.
Axial (first row), coronal (central row), and sagittal (bottom row) central slice from the original MRI volume (left column), the bias-corrected MRI volume (central column), and the estimated bias field map with the chosen combination of N4ITK parameters (right columns), for a randomly selected patient. The darker region in bias field estimation (right column) indicates where the bias field is higher.

