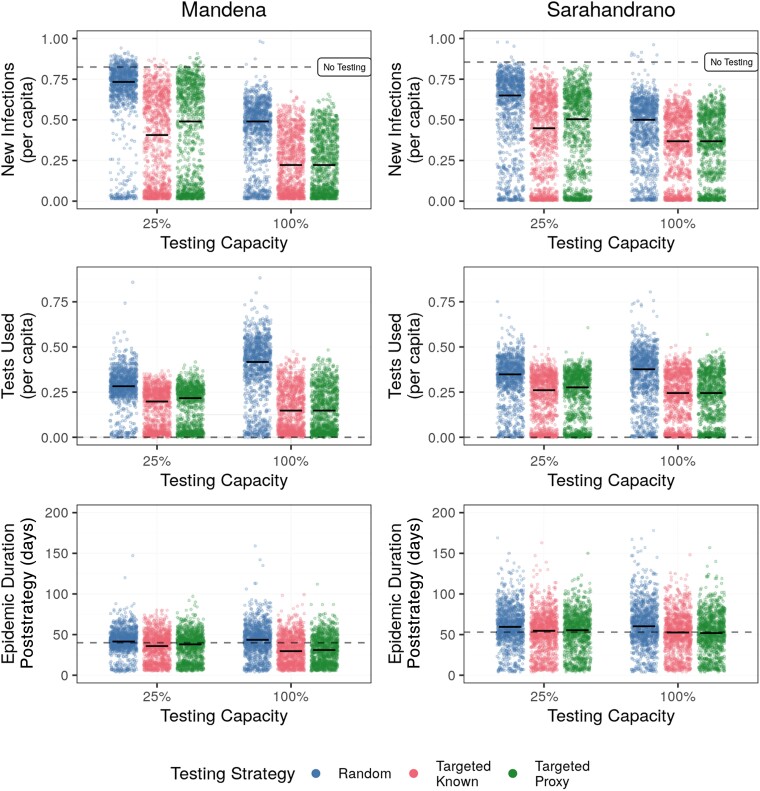
Figure 2.
Targeted testing using proxies performs better than random at low testing capacity and similar to using known degree centralities at high testing capacities. Testing capacities correspond to monthly testing capacities equal to testing 25% and 100% of the total population. The dashed black line represents median values from simulations with no testing. Raw data are represented by points and median values per strategy are represented by bold horizontal lines. The figure displays results from 1000 simulations for each combination of testing capacity and control strategy.

