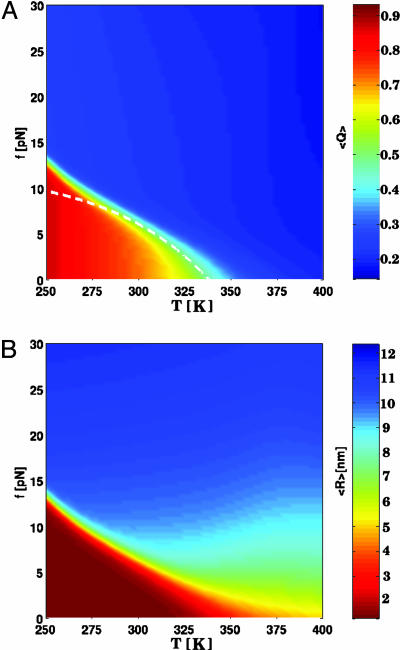
Fig. 2.
Phase diagram for the P5GA hairpin. (A) Diagram of states obtained by using the fraction of native contacts as the order parameter. The values of the thermal average of the fraction of native contacts, 〈Q〉, are color-coded as indicated on the scale shown on the right. The dashed line is a fit by using Eq. 6 to the locus of points in the (f, T) plane that separates the folded hairpin from the unfolded states. (B) Plot of the phase diagram in the (f, T) plane by using the mean end-to-end distance 〈R〉 as the order parameter. Although the diagram of states is qualitatively similar to A, there are quantitative differences in estimates of Tm at f = 0. However, estimates of threshold force values at T < Tm are similar in A and B.

