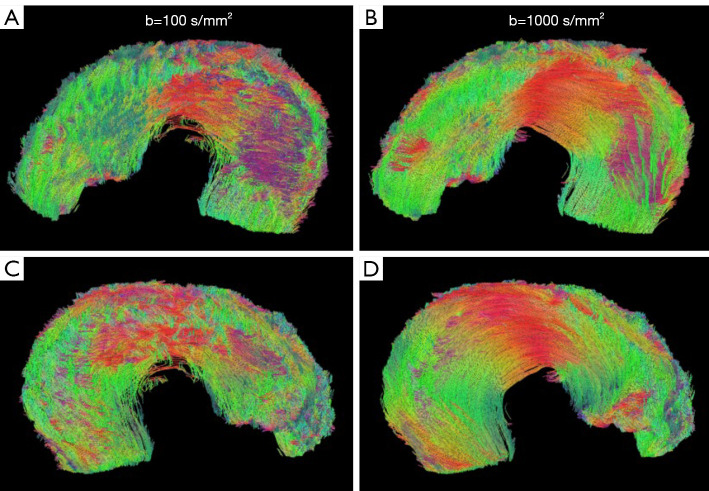
Figure 4.
Tractography results of the meniscus were generated using GQI reconstruction at different diffusion gradients (100 and 1,000 s/mm2). (A,B) are superior views and (C,D) are inferior views. The tractography is visually comparable at the two different b values, with better organized tracts at the higher b value. GQI, generalized q-sampling imaging.

