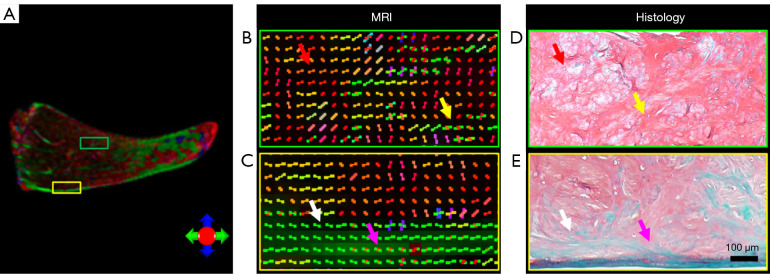
Figure 5.
Fiber orientation images of meniscus were generated using GQI (A,B,C), with corresponding Safranin O (red = proteoglycans)/fast green (blue = collagen) stained histology (D,E). The green box is near the femoral surface and the yellow box is adjacent to the tibial surface. The matrix orientation in histology is similar to the MRI findings (red, yellow, white, and purple arrows). The colors (panels A,B,C) represent different fiber orientations, with green denoting a horizontal fiber orientation, blue denoting a vertical fiber orientation, and red denoting a fiber orientation perpendicular to green and blue. GQI, generalized q-sampling imaging; MRI, magnetic resonance imaging.

