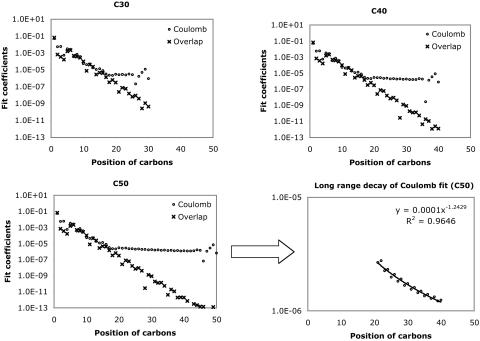
Fig. 1.
Decay behavior of the fit coefficients ( ) for C30H62 ∼ C50H102, with the Coulomb and overlap metric, where μ = ν = s function centered on the first carbon (C1) atom, and K = s function centered on the varying carbon atoms. Absolute values of the fit coefficients are plotted as a function of the distance between μν and K on a logarithmic scale. The long-range behavior with the Coulomb metric for C50H102 is magnified in the bottom right panel.

