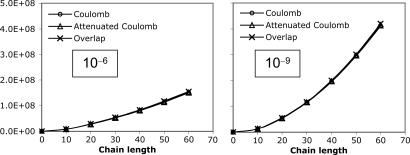
Fig. 7.
Scaling behavior of the coefficients  (defined in Eq. 11) for three metrics and two drop tolerances, 10–6 (Left) and 10–9 (Right). See the Fig. 6 legend and the text for additional details. No significant difference in the growth behavior of the significant
  between the different metrics is evident. Quadratic growth in the number of significant coefficients is evident with the 10–9 tolerance.

