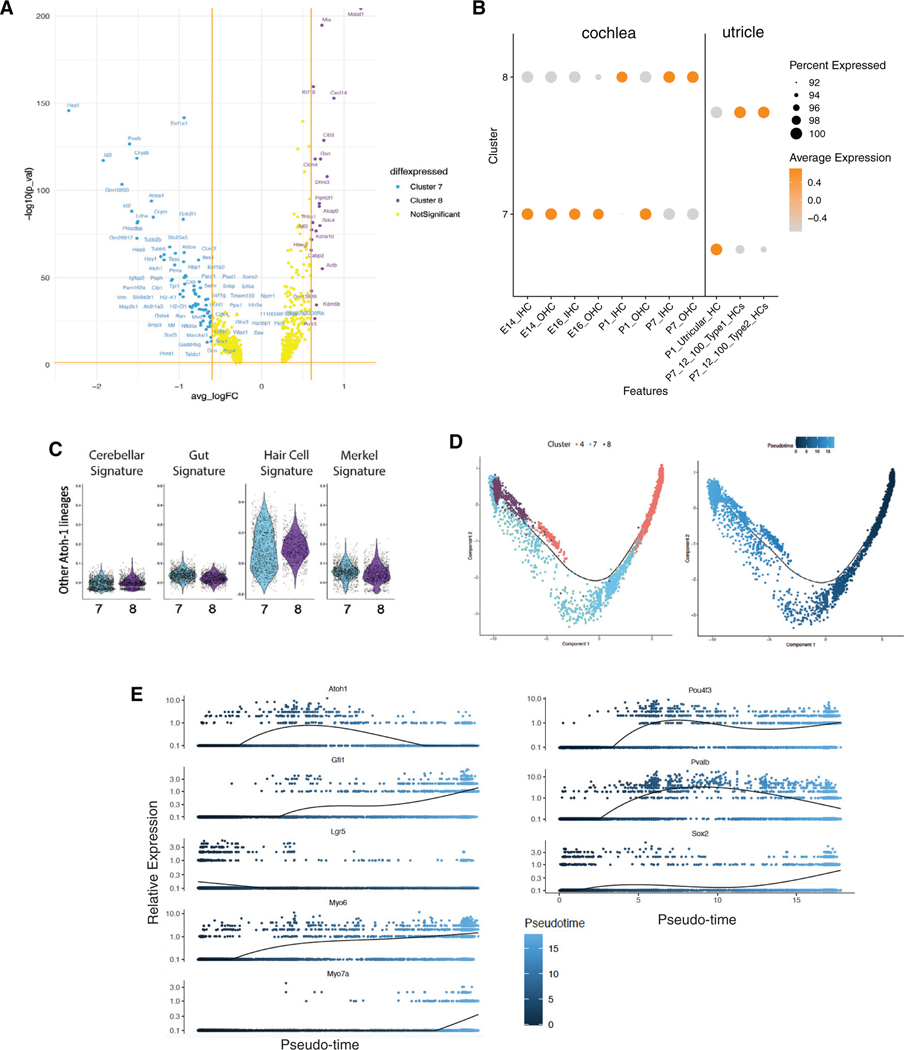
Figure 3. Molecular characterization and pseudotemporal trajectories of hair cells in cochlear organoids.
(A) Volcano plot indicating genes differentially expressed between two clusters of hair cells in organoids: clusters 7 (primarily in day 0 organoids) and 8 (primarily in day 10 organoids).
(B) Aggregate expression of markers specifically expressed in E14, E16, P1, or P7 cochlear hair cells in clusters 7 and 8. Orange indicates high expression, whereas gray indicates low expression.
(C) Aggregate expression of genes expressed in cochlear and non-cochlear Atoh1-dependent cell lineages in clusters 7 and 8.
(D) Monocle pseudotime trajectory delineates transdifferentiation of Lgr5+ supporting cells (cluster 4) to hair cells (clusters 7 and 8). Trajectory labeled by cluster number (left) or pseudotime (right). For an interactive version of the trajectory analysis, see https://umgear.org/lgr5org.
(E) Expression of known marker genes with dynamic expression across pseudotime.

