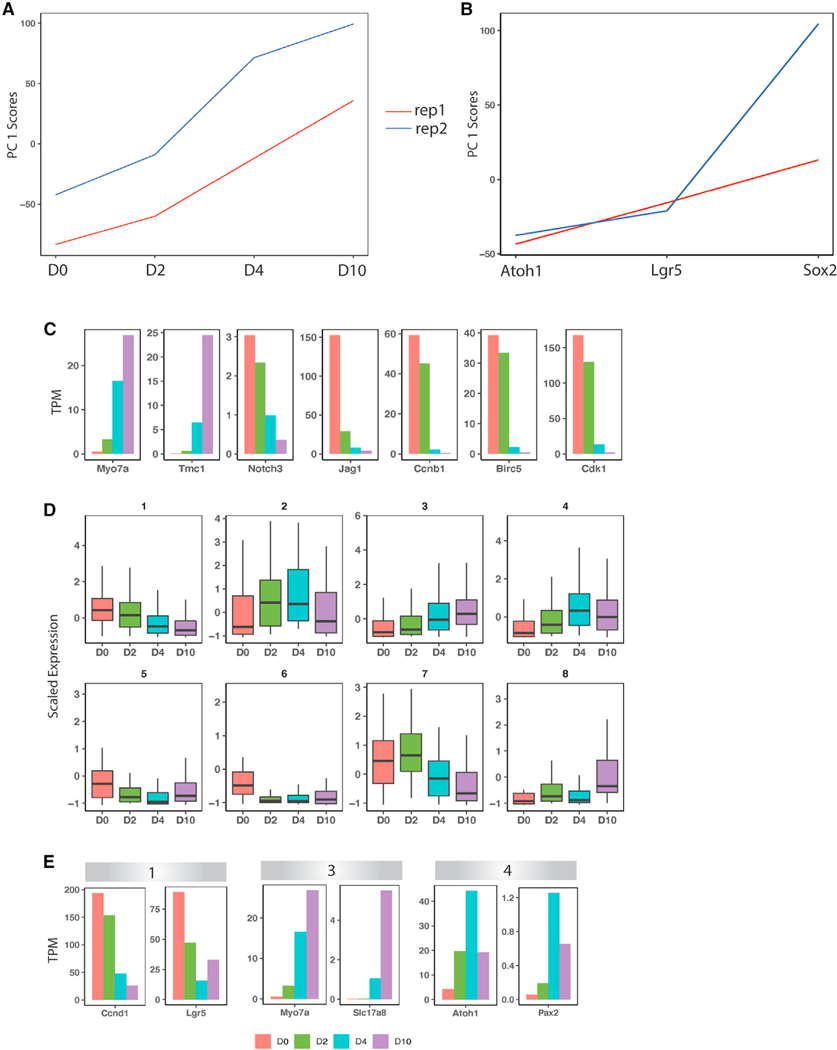
Figure 4. Clustering analysis of bulk RNA-seq data from days 0, 2, 4, and 10.
(A) Principal-component analysis (PCA) of the day 0, 2, 4, and 10 bulk RNA-seq samples and their replicates.
(B) PCA of Atoh1+, Lgr5+, and Sox2+ cells and their replicates from P2 mouse cochlea.
(C) Expression of select genes in day 0, 2, 4, and 10 samples.
(D) K-means clustering of day 0, 2, 4, and 10 bulk RNA-seq samples, showing eight gene expression patterns.
(E) Expression of select genes in groups 1, 3, and 4 from (D).

