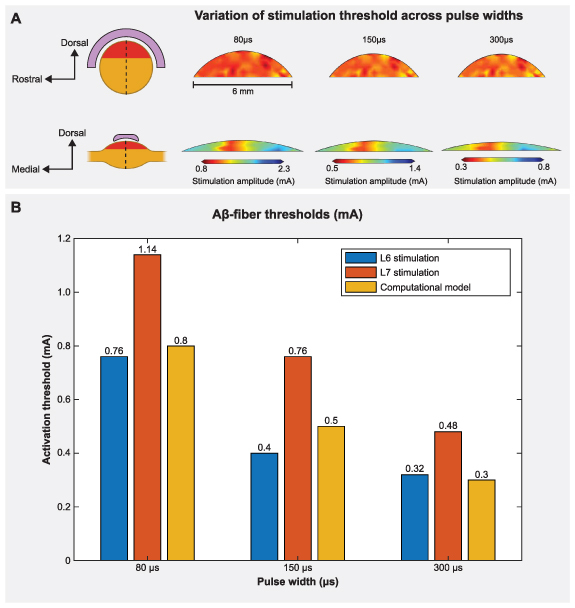
Figure 3.

DRGS amplitudes required to elicit one or more action potentials (activation threshold) in Aβ-fibers for stimulation with an Injectrode in the feline model. (A) The contour plots show variation of activation thresholds along the dorsal-rostral plane and the dorsal-medial plane for three different pulse widths. The red shaded region indicates the location of the somata of the primary sensory neurons, enclosed by the Injectrode at the top. The dorsal-rostral cross section (top) is taken along the midline of the dorsal-medial view (bottom), marked by a dashed line, and vice versa. (B) Comparison of minimum activation thresholds generated by our computational model with the ECAP thresholds from the acute experiments (for two lumbar levels) across three different pulse widths [28].
