
Figure 4.
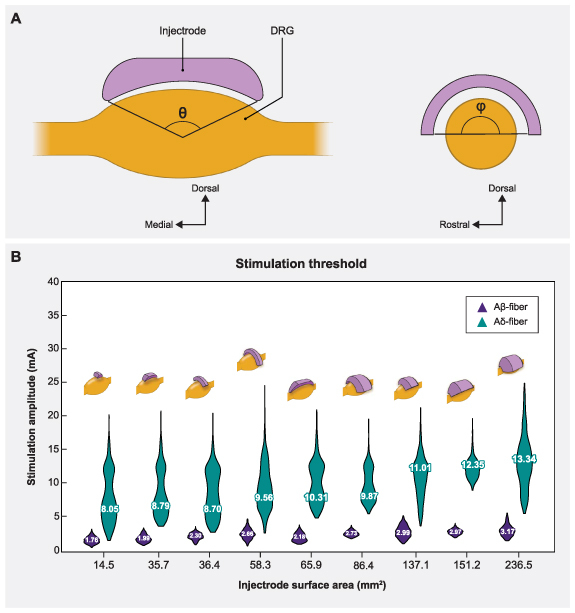
Sagittal and transverse cross sections of the DRG and the Injectrode indicating the various angles of coverage of the Injectrode and the corresponding mean activation thresholds. (A) The angles in both planes (θ,ϕ) varied from 30° to 150° at an interval of 60°, thus generating a total of nine models. (B) Plots showing comparison between the distribution of activation thresholds of Aβ- and Aδ-fibers generated by the various Injectrode geometries with the mean values inset and the corresponding Injectrode geometry at the top of each violin plot.