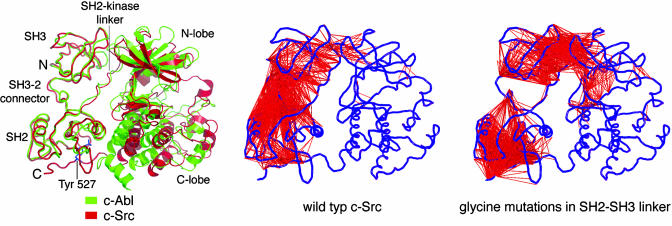
Fig. 5.
Structure and dynamics of the Src and Abl kinases. (Left) The structures of c-Abl (green) and c-Src (red) are shown superimposed on their SH2 and SH3 domains (69, 70, 75). Note the dissimilarity in the conformation of the kinase domains. (Center and Right) The results of unbiased molecular dynamics simulations of c-Src. Residues in different domains that move in a correlated manner in the simulation are linked by a red line. These correlations were calculated by superimposing each instantaneous structure in the simulation on the C-terminal lobe of the kinase domain, and motions that are correlated to the C-terminal lobe are removed by this procedure. (Right) The mutation of residues in the SH2–SH3 linker to glycine reduces the correlation in the dynamics of these domains. Similar results were obtained for c-Abl. (Modified from refs. 8 and 75).

