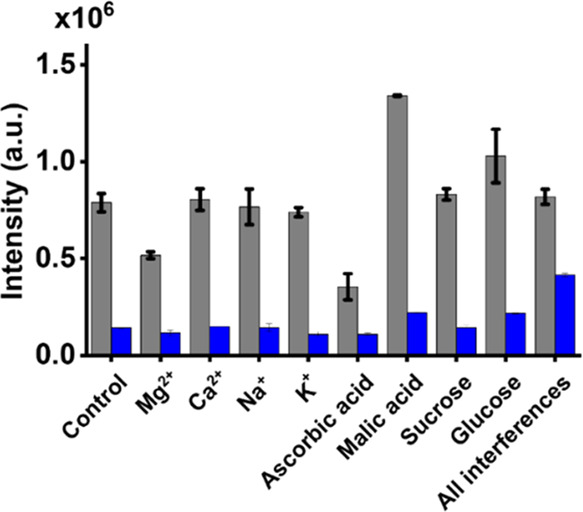
Figure 2.

Examination of the effects of interference species. Bar graphs showing the summarized results (SI Figure S9) of the fluorescence intensity at 616 nm of the fluorescence spectra of the samples containing B. cereus (0.2 mg mL–1) and interference species (gray) and interference species alone (blue) prepared in Tris buffer (pH 8) obtained by adding Eu3+ (75 mM, 10 μL) as the trapping and sensing probes, followed by bleach treatment and the addition of TC (30 μM, 30 μL).
