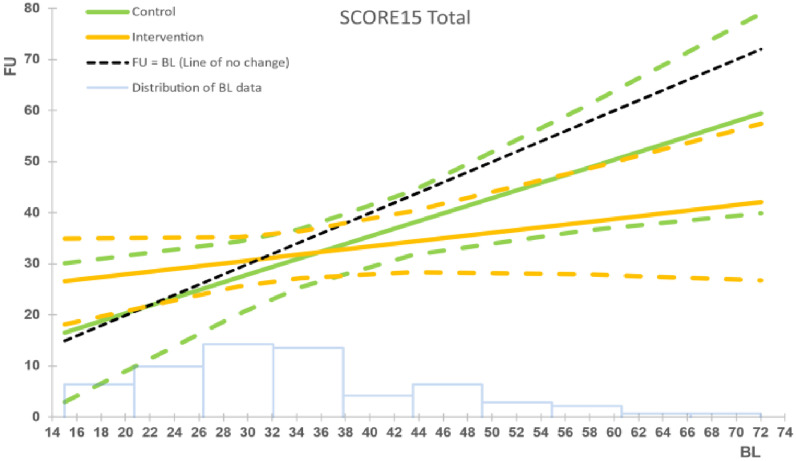
Figure 3.
Intervention vs. control group for family functioning (SCORE-15), ITT analysis. The black dashed line represents the line of no change at follow up (FU) from baseline (BL). The solid coloured lines represent the model means for control (green) and intervention (orange) groups, with the corresponding dashed lines being the 95% confidence intervals. The faint blue histogram indicates the distribution of baseline data. The histogram is not to scale, and is intended to be purely suggestive. Bar height values must not be read from the chart.

