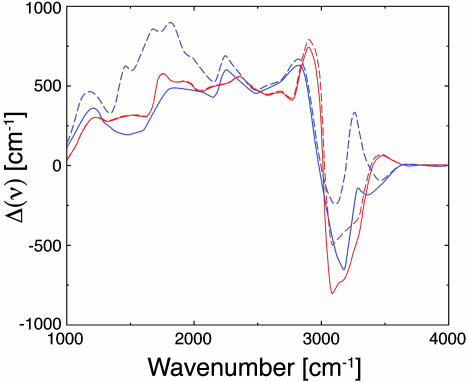
Fig. 2.
Theoretical difference spectra Δ(ν) (see text) scaled to a concentration c = 0.85 M. The red solid line is the spectrum of the HCl solution minus that of bulk water and that of the Cl. The red dashed line is the spectrum of HCl solution minus that of bulk water. The blue solid line is the spectrum of the H2F2 solution minus that of bulk water and that of the bifluoride ion. The blue dashed line is the spectrum of H2F2 solution minus that of bulk water.

