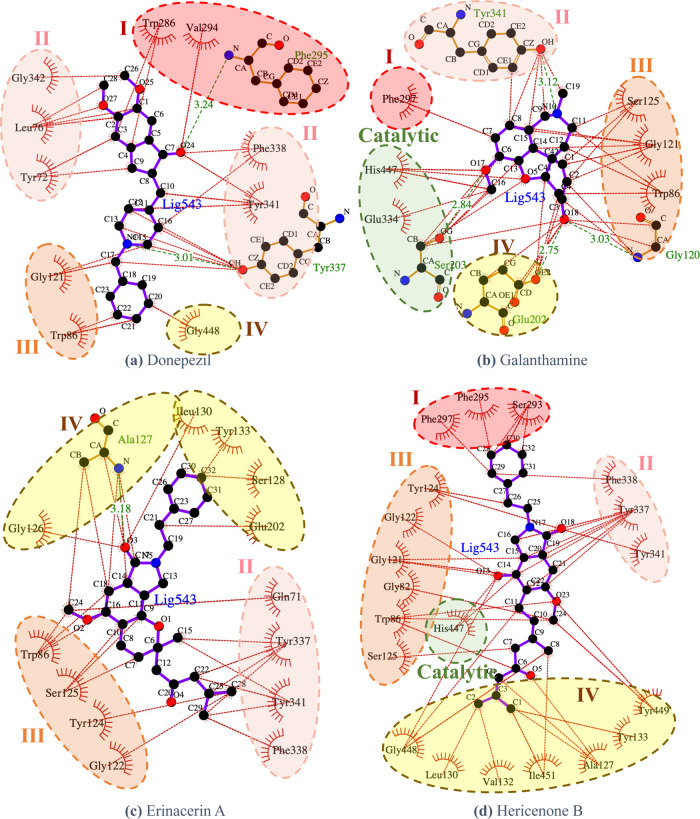
Figure 4.
Interaction analysis of the amino acid residues of AChE and the enzyme inhibitors (a) donepezil, (b) galanthamine, (c) erinacerin A, and (d) hericenone B generated by LigPlot 2.2.42 Red, pink, orange, and yellow dashed circles represent Subsite I (top region), Subsite II (outside region), Subsite III (inside region), and Subsite IV (bottom region), respectively.

