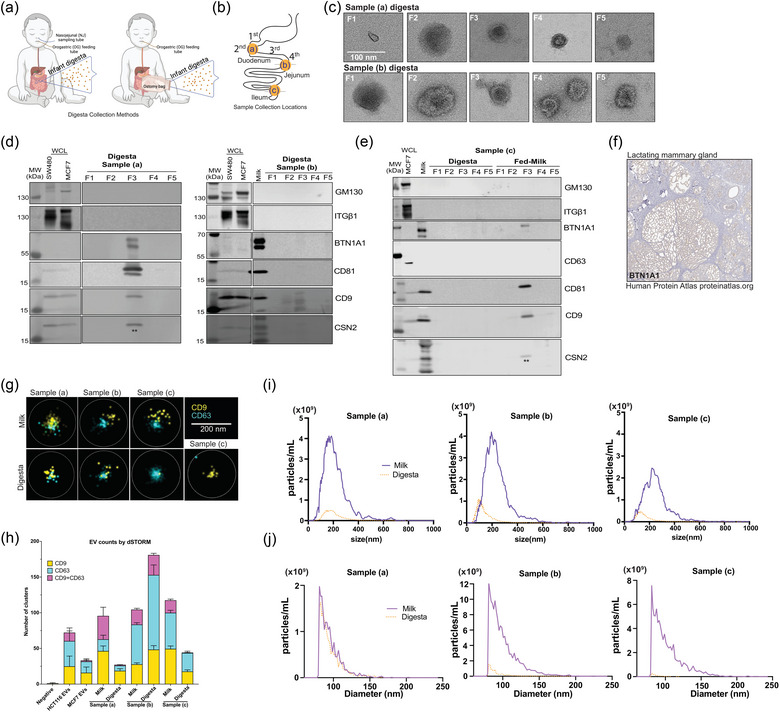
FIGURE 4.

Pipeline effectively isolates extracellular vesicles from neonatal human digesta (dEVs). (a) Neonatal human digesta was collected from infants in the NICU after obtaining parental informed consent. Inclusion criteria included infants already admitted to the NICU, greater than 26 weeks corrected gestational age with an indwelling nasogastric or orogastric feeding tube who were tolerating full enteral feeding volumes. Infants were excluded from the study if they had anatomic or functional gastrointestinal disorders, were medically unstable, were non‐viable, or had disorders that would be expected to affect normal digestion. Before feeding, a nasal tube was placed into the proximal small intestine. Feeds were delivered via a gastric tube over 30 min or less. (b) Data are from three participants with sampling tubes placed along the duodenum (a, b) or from an ostomy (c), as shown. (c) Transmission electron micrographs (TEM) of fractions (F)1–5 of neonatal digesta collected from participants (a) and (b). Scale bar = 100 nm. (d) Western blotting assessed the protein profile of isolated dEVs in the participants (a), and (b) or (e) the digesta and milk samples from participant (c). Fifteen micrograms of SW480 (colorectal cancer cells), MCF7 (breast cancer cells) whole cell lysates (WCL) and/or whole milk were loaded as positive controls. Each digesta fraction was concentrated over an Amicon® concentration column (100 kDa MWCO) to allow for loading of the entire fraction volume in the gel; therefore, the data shown represent all the proteins in the fraction from a 1 mL digesta sample. Samples were loaded on a 4%–12% Bis‐tris gel, transferred to a PVDF membrane, and probed according to MISEV 2018 guidelines, including controls for common proteins found in human milk (BTN1A1, LALBA, CSN2). LALBA and CSN2 were not detected. To preserve the samples, membranes were re‐probed for some proteins. ** indicates residual CD9 signal from re‐probing the membrane for CSN2. CSN2 was not detected in EV samples, see banding pattern in whole milk positive control in participants’ (b) and (c) blots for comparison. ITGβ1 was detected by re‐probing the membrane after GM130. Both antibodies are rabbit, resulting in the smear in control WCL lanes for ITGβ1. The isolated fractions were all negative. (f) Immunostaining for BTN1A1 in lactating mammary gland. Image provided courtesy of Human Protein Atlas (Uhlén et al., [Link], 2005.). (g) Representative images of direct stochastic optical reconstruction microscopy (dSTORM). Human milk and digesta EV samples were affinity captured on microfluidic chips using CD9/CD81/CD63 antibodies and labeled with CD9‐CF488 (excitation (ex)/emission (em): 490/515 nm) and CD63‐CF568 (ex/em: 562/583 nm) antibodies for imaging on the Nanoimager S Mark II microscope (ONI) with 100X oil‐immersion objective and freshly prepared dSTORM‐imaging buffer. Data were processed on NimOS software (version 1.19, ONI). Subpopulation analyses of EVs that express one or two markers were analysed using ONI's online platform CODI (https://alto.codi.bio). We used a density‐based clustering analysis with drift correction and filtering to evaluate each vesicle. At least five localizations were required to constitute a vesicle and at least three localizations of one protein were required to consider the localizations a real signal. Data were compiled in Microsoft Excel™ and (h) the localizations within each sample were summarized using GraphPad Prism® v10. (i) Nanoparticle tracking analysis (NTA) was performed on matched fed‐human milk and neonatal digesta F3 isolated from participants (a)–(c) and stained with Di8‐ANEPPS. Data represent the average of triplicate runs for each sample and the data is smoothed using GraphPad Prism® v10. (j) Resistive pulse sensing measurements were performed on matched fed‐human milk and neonatal digesta F3 isolated from participants (a)–(c). EV samples were diluted 1:20 in 1% Tween‐20 (v/v) in 0.2 µm filtered PBS and loaded in polydimethylsiloxane cartridges (diameter range 65 nm to 400 nm, C‐400). From each 4 µL sample, four thousand events were collected using a Spectradyne nCS1™ instrument and analyzed using the accompanying nCS1™ Data Viewer (Version 2.5.0.325). Size and concentration measurements were calibrated based on 150 nm beads. Concentrations were adjusted using Microsoft Excel™ and graphs were made in GraphPad Prism® v10.
