Fig. 4.
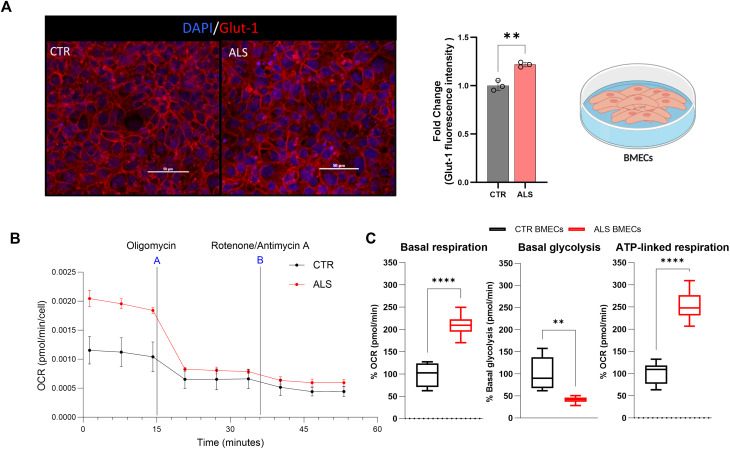
C9-ALS BMEC-like cells have an increased glucose metabolism and altered mitochondrial respiration A) Healthy donor hi-PSCs derived BMEC-like cells (CTR BMECs) and C9-ALS donor hi-PSCs derived BMEC-like cells (ALS BMECs) confocal images. BMEC-like cells were fixed in 100% MeOH. Scale bar equals 50µM. Images and results represent confocal z-stacks analysed in 3D volume. Glucose-1 transporter (Glut-1) in red and DAPI in blue for the nuclei staining. Error bars represent the standard deviation of triplicate Transwell™ filters. Statistical significance was determined using Student’s unpaired t-test (****p < 0.0001). At least a total of 5 images were acquired per each condition, with a minimum of 3 technical replicates for a total of 3 biological replicates (N = 3, total images per condition = 45). B) Mitochondrial Real-Time ATP rate test was carried out on healthy donor hi-PSCs derived BMEC-like cells (CTR BMEC-like cells), and 3 C9-ALS donors hi-PSCs derived BMEC-like cells (ALS BMEC-like cells). Data were acquired and analysed using the Agilent Technologies Sea-horse platform and software. Oxygen consumption rate (OCR) measurement per cells is represented as a time curse. The addition of the mitochondrial drugs Olygomycin (A) and Rotenone/Antimycin A (B) are indicated in the graph. C) Mitochondrial Real-Time ATP rate test was carried out on healthy donor hi-PSCs derived BMEC-like cells (CTR BMEC-like cells), and 3 C9-ALS donors hi-PSCs derived BMEC-like cells (ALS BMEC-like cells). Data were acquired and analysed using the Agilent Technologies Sea-horse platform and software. Error bars represent the standard deviation of triplicate wells N = 3. Data is plotted as Min-Max Box and Whisker. Statistical significance was determined using Student’s unpaired t-test (****p < 0.0001)

