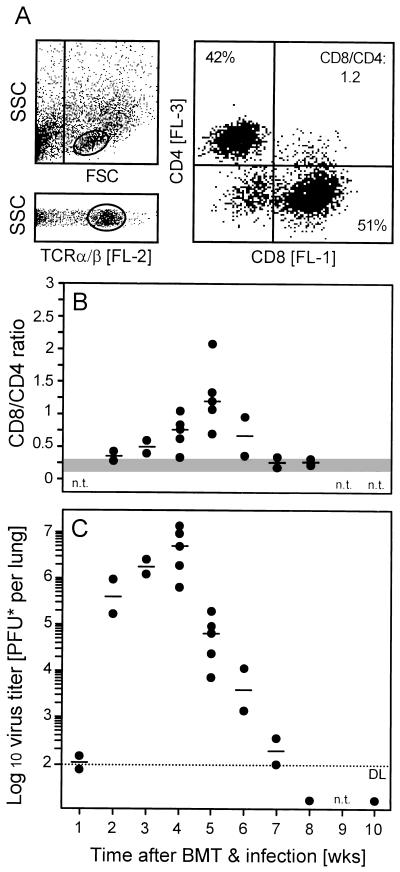
FIG. 2.
Preferential recruitment of CD8 T cells to the infected lungs and control of pulmonary infection. (A) Three-color cytofluorometric analysis of lung infiltrate lymphocytes in the combination FITC (FL-1)-CD8 plus PE (FL-2)-TCR α/β plus RED613 (FL-3)-CD4. A lymphocyte gate was set in the FSC-versus-SSC plot, representing cell size and cell granularity, respectively (upper left); a second gate was set on positive FL-2 to select cells expressing TCR α/β (lower left). (Right) Expression of CD4 and CD8 among the FL-2-positive α/β T cells, shown in a two-dimensional dot plot of FL-3 and FL-1 fluorescence, respectively. The percentages of CD4 and CD8 T cells as well as the CD8/CD4 ratio are indicated. The analysis of the subpopulations was based on 20,000 α/β T cells. (B) Kinetics of lung infiltration. For independent but analogous transplantations, CD8/CD4 ratios within pulmonary α/β T cells were determined in weekly intervals. Each closed circle represents the analysis at the indicated time point of a particular transplantation. Data refer to a pool of pulmonary infiltrate cells derived from five recipients. The median values for the independent transplantations are indicated by dashes; the shaded area indicates the range of CD8/CD4 ratios observed in uninfected recipients under otherwise corresponding conditions. n.t., not tested. (C) Kinetics of murine CMV replication in the lungs. Virus titers in the lungs of infected recipients were determined for the transplantations shown in panel B. Closed circles represent the median values of the virus titers of three recipients per transplantation and time point. The median values for the independent transplantations are marked by dashes. The dotted line indicates the detection limit (DL) of the plaque assay. n.t., not tested.

