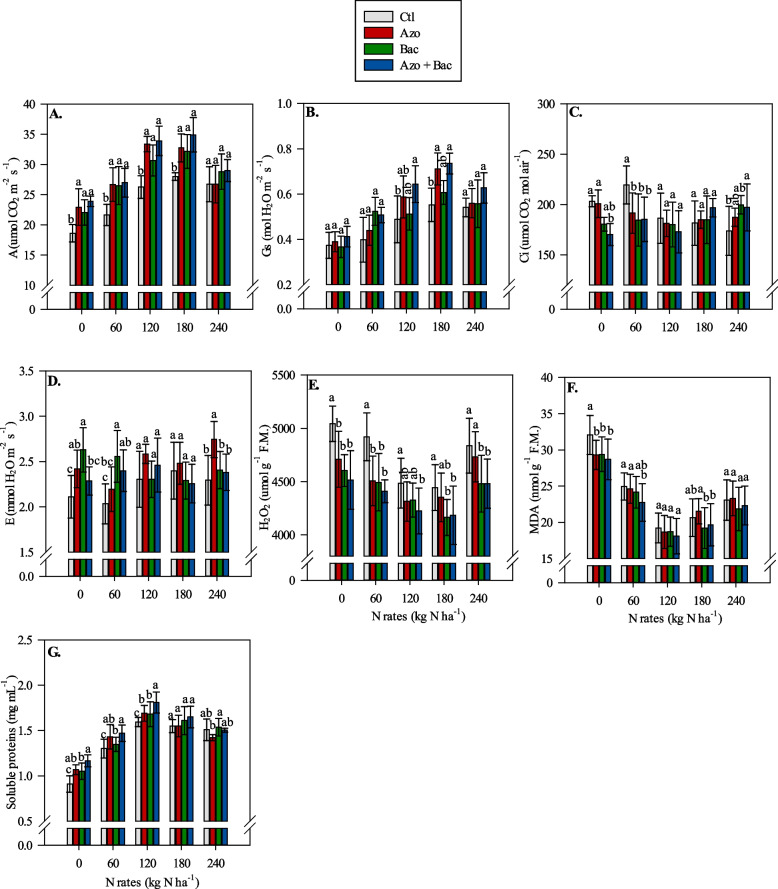
Fig. 3.
Interaction between inoculations and N rates on net photosynthetic rate (A) (A), stomatal conductance (Gs) (B), internal CO2 concentration in the substomatal chamber (Ci) (C), leaf transpiration (D), H2O2 (E), malondialdehyde (MDA) (F) and leaf soluble protein concentration (G). Lowercase letters represent the difference between inoculations at each N rate; Ctl = control, Azo = single inoculation with A. brasilense, Bac = single inoculation with B. subtilis and Azo + Bac = co-inoculation with A. brasilense and B. subtilis; ± refers to standard deviation of the mean

