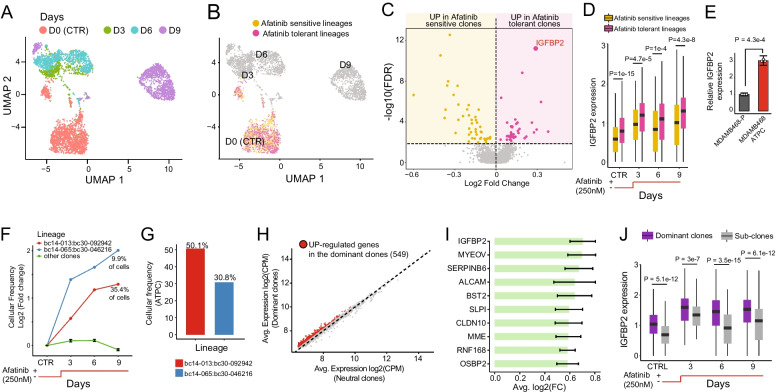
Fig. 2.
Retrospective and Prospective lineage tracing analysis. A UMAP representation of MDAMB468 cells colour-coded for the days of treatment. B Retrospective projection of the afatinib tolerant persisted lineages on a UMAP representation of untreated MDAMB468 cells at Day 0. C Differential expression between afatinib tolerant persisted lineages versus afatinib sensitive lineages on untreated MDAMB468 cells (i.e. cells from Day 0). D Expression distribution of IGFBP2 in afatinib tolerant persisted lineages and afatinib sensitive lineages over time. Statistical differences were estimated using a two-tailed Wilcoxon test. E IGFBP2 expression in MDAMB468-P and MDAMB468-ATPC cells measured by real-time quantitative PCR. The statistical difference was estimated using a two tailed t-test. F Cellular frequency of the afatinib tolerant clones bc14-013:bc30-092942 and bc14-013:bc30-092942 and all other clones at the sequenced time points (CTRL (Day 0), Day 3, Day 6, Day 9). G Cellular frequency of clones bc14-013:bc30-092942 and bc14-013:bc30-092942 in the MDAMB468-ATPC cell line. H Up-regulated genes identified by comparing cells belonging to the dominant clones to cells belonging to the neutral clones. I Average log2 fold change (FC) of the top ten up-regulated genes from (C). A 95% confident interval is reported. J Expression distribution of IGFBP2 in dominant and neutral clones over time. Statistical differences were estimated with a two-tailed Wilcoxon test

