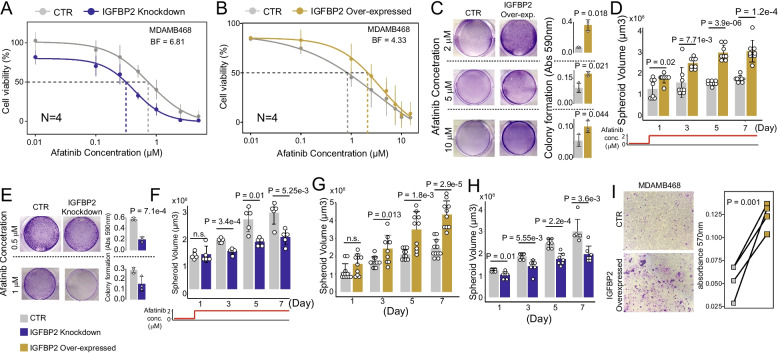
Fig. 3.
Identification of genes driving cellular expansion during afatinib adaptation. A Dose–response curve in terms of cell viability following treatment of MDAMB468 control (CTR) and IGFBP2-knockdown cells with afatinib at the indicated concentrations. Significance was assessed using Gaussian processes and BF is the estimated Bayesian Factor expressed in bits representing the difference between the two dose–response curves (Methods section). A value of 6.81 corresponds to a very strong significant difference between the two dose–response curves [52]. B Dose–response curve in terms of cell viability of MDAMB468 control (CTR) and IGFBP2-overexpressing cells following treatment with afatinib at the indicated concentrations. Significance was assessed as in (A). A value of 4.3 corresponds to a strong significant difference between the two dose–response curves [52]. C Colony assay (representative images) for MDAMB468 control (CTR) and IGFBP2-overexpressing cells after 10 days of afatinib exposure at 2, 5 and 10 µM (left). Quantification is reported on the right. Experiments were performed in triplicate. D Spheroid volume growth of MDAMB468 control and IGFBP2-overexpressing cells with 2 µM afatinib (see Methods section) over time. E Colony assay (representative images) for MDAMB468 control and IGFBP2-knockdown cells after 3 days of afatinib exposure at 0.5 and 1 µM (left). Quantification is reported on the right. Experiments were performed in triplicate. F Spheroid volume growth of MDAMB468 control and IGFBP2-knockdown cells with 2 µM of afatinib over time. G Spheroid volume growth over time of MDAMB468 IGFBP2-overexpressing cells. H Spheroid volume growth over time of MDAMB468 IGFBP2-knockdown cells. I Transwell migration assay of MDAMB468 IGFBP2-overexpressing cells. Reported p values from panels C to I were estimated using two-tailed t-test

