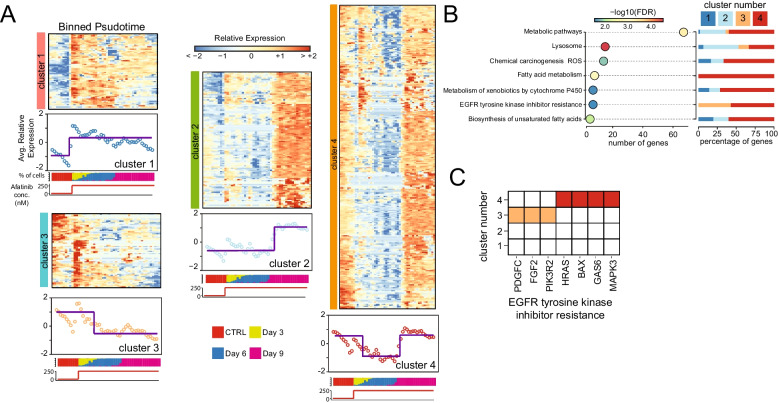
Fig. 4.
Gene expression dynamics in response to afatinib adaptation. A 549 driver genes clustered according to their expression. Cells are binned according to their reconstructed pseudotime. The average expression profile of the genes in the cluster and the cell composition of each bin as a percentage of cells in each timepoint is reported below each cluster. B Gene ontology enrichment analysis of 549 genes (bottom) and for each enriched term the percentage of genes belonging to a specific cluster of (A). C Genes in the enriched term EGFR tyrosine kinase inhibitor resistance and the cluster of (A) in which they fall

