Fig. 1.
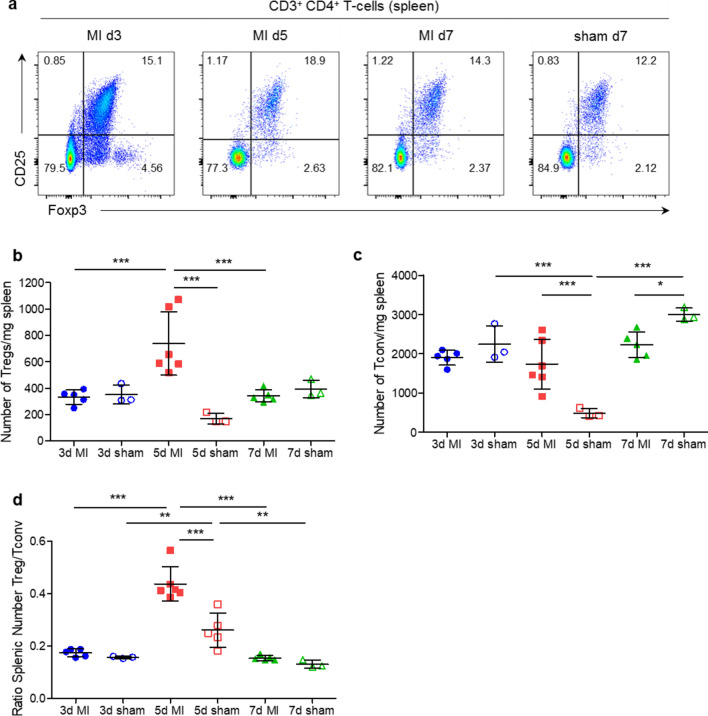
CD4+ T-cell subsets in the spleen. a Flow cytometry plots showing CD25 and Foxp3 expression in splenic CD4+ T-cells. b, c Absolute numbers of CD4+ Foxp3+ CD25+ (Treg; b) and CD4+ Foxp3− (Tconv; c) T-cells in the spleens of post-MI and sham-operated animals on days 3, 5, and 7 after surgery. d Ratio of splenic Treg/Tconv numbers in the infarcted and sham-operated mice 3, 5, and 7 days after sham or MI surgery. MI myocardial infarction. Data are presented as the mean ± SD. *P < 0.05, **P < 0.01, ***P < 0.001 (b-d two-way ANOVA)

