Fig. 7.

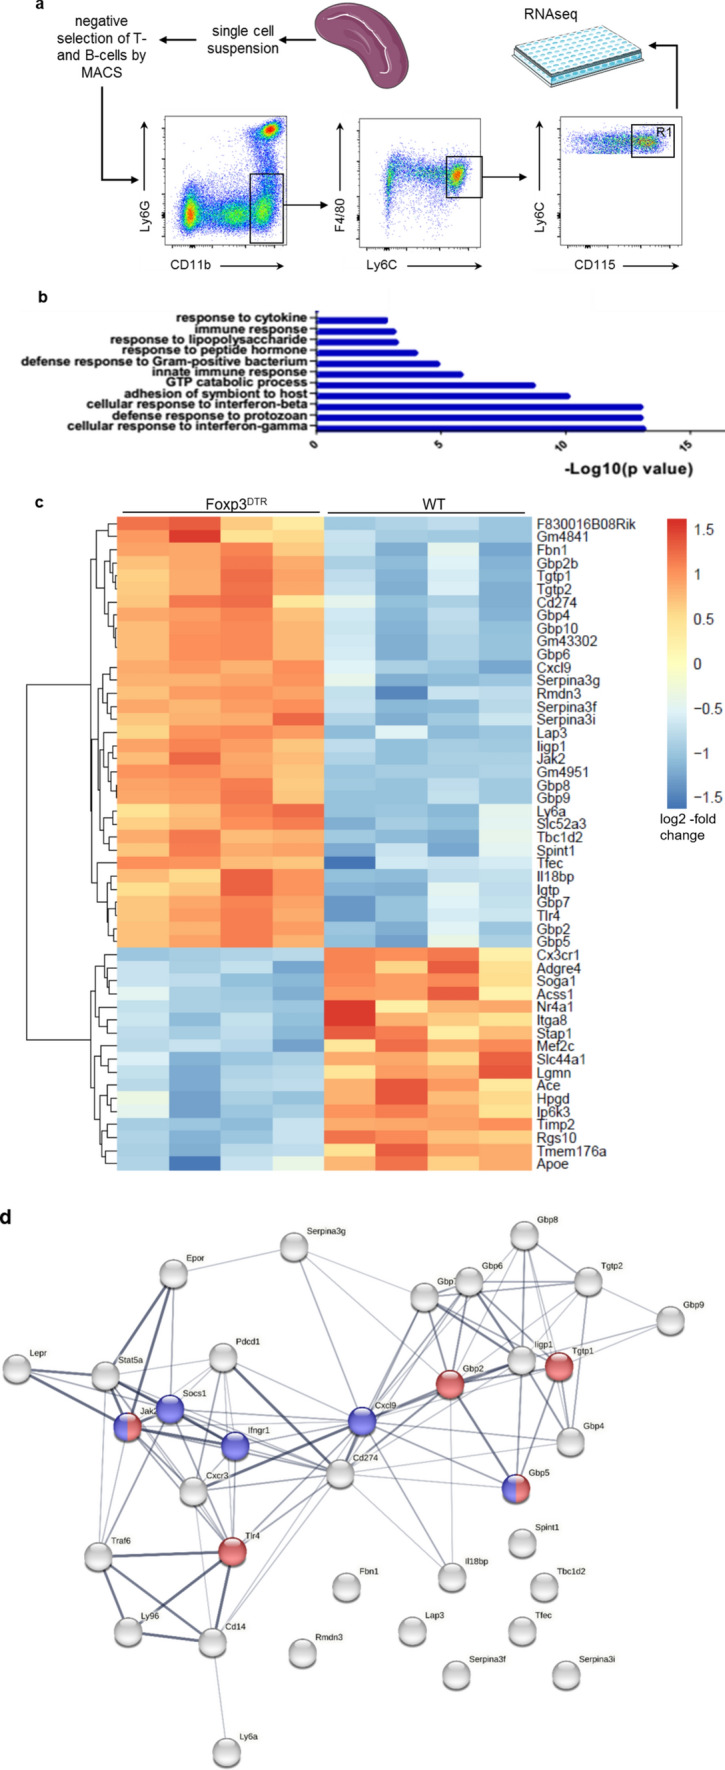
Transcriptome analysis of Ly6Chigh monocytes in the spleens of WT and Foxp3DTR mice 5 days after MI. a After CD3+ and CD19+ cells were depleted by MACS separation columns, Ly6Chigh monocytes were sorted from R1 as CD11b+ Ly6G− F4/80+ Ly6Chigh CD115+ cells. b Gene ontology analysis showing clusters of upregulated genes in Ly6Chigh monocytes of Foxp3DTR vs. those of WT mice. c Cluster analysis of RNA sequencing results depicted as a heatmap (n = 4 animals per group; adjusted p < 0.05 for Foxp3DTR vs. WT). Images were made using the Innate DB database (https://www.innatedb.com/) or the pheatmap package in R (https://www.rdocumentation.org/packages/pheatmap/versions/1.0.12/topics/ pheatmap). d Protein–protein interaction network model of the top upregulated genes. Red represents GO: 0034341“Response to interferone gamma”; Blue represents WP1253 “Type II Interferon signalling” (FDR < 0.0001 each)
