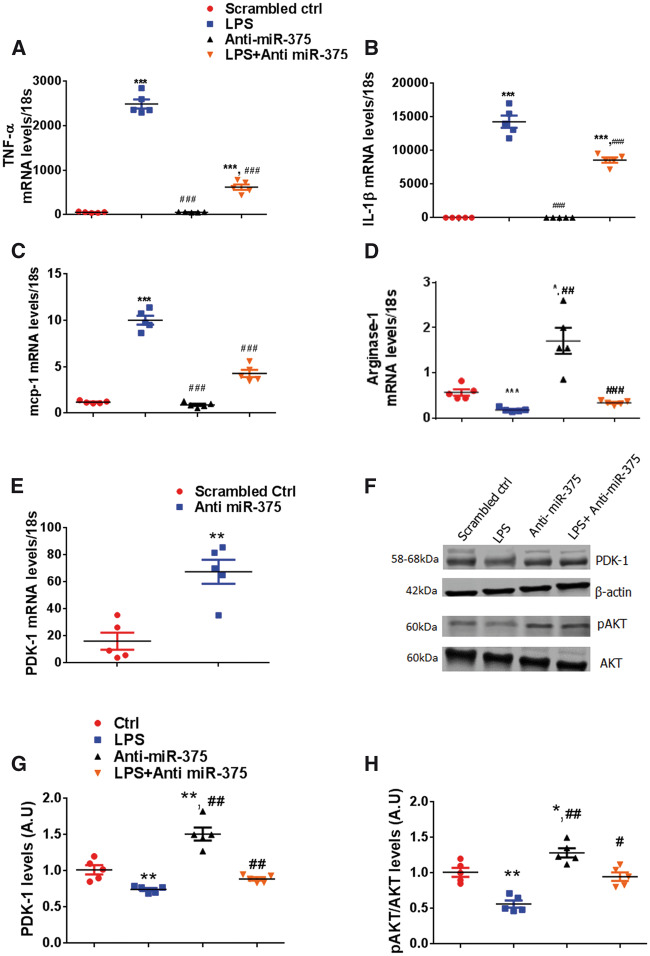
Figure 6.
Modulation of inflammatory response by knockdown of miR-375 in macrophages. RAW cells were treated with LPS (10 ng/mL), LPS (10 ng/mL) + anti miR-375 (50 nM), or anti miR-375 alone (50 nM) for 24 h. (A–D) Relative mRNA expression levels of TNF-α, IL-1β, mcp-1, and arginase-1 were measured by quantitative RT–PCR, normalized to 18S. n = 5/group. ***P < 0.001 vs. control group; ###P < 0.001 vs. LPS treated group. (E) PDK-1 mRNA levels were measured by quantitative RT–PCR, normalized to 18S. n = 5/group. **P < 0.001 vs. scrambled ctrl. (F–H) Representative western blots and the quantification for PDK-1, pAKT protein expression in LV tissue at 5 days post-MI. Equal loading of proteins in each lane is shown by total AKT and β-actin. n = 5/group. **P < 0.01, *P < 0.05 vs. control group; ##P < 0.01, #P < 0.05 vs. LPS treated group.

