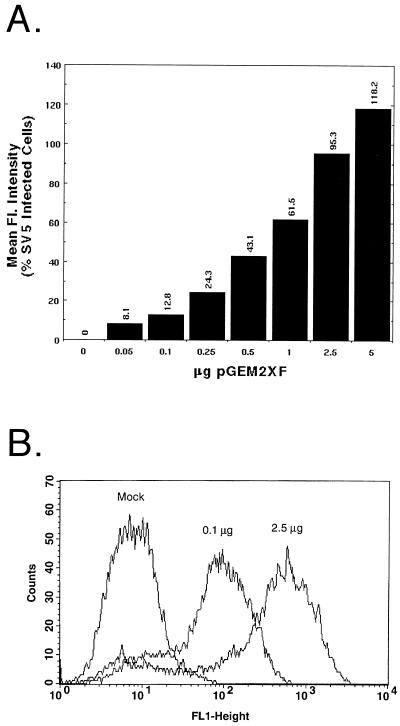
FIG. 1.
Expression of varying surface densities of the SV5 F protein. (A) Duplicate plates of vTF7-3-infected CV-1 cells were transfected (as described in Materials and Methods) with varying quantities of SV5 F DNA and pGEM3X DNA to give a final DNA amount of 7.5 μg per 6-cm-diameter plate. Samples were processed for flow cytometric analysis using MAb F1a as described in Materials and Methods. The MFI was compared to that observed in SV5-infected cells at 18 h p.i., with the MFI of mock-transfected samples subtracted. (B) Example of raw data from flow cytometric analysis, showing data for mock-infected cells or cells transfected with 0.1 μg of SV5 F DNA and 2.5 μg of SV5 F DNA.

