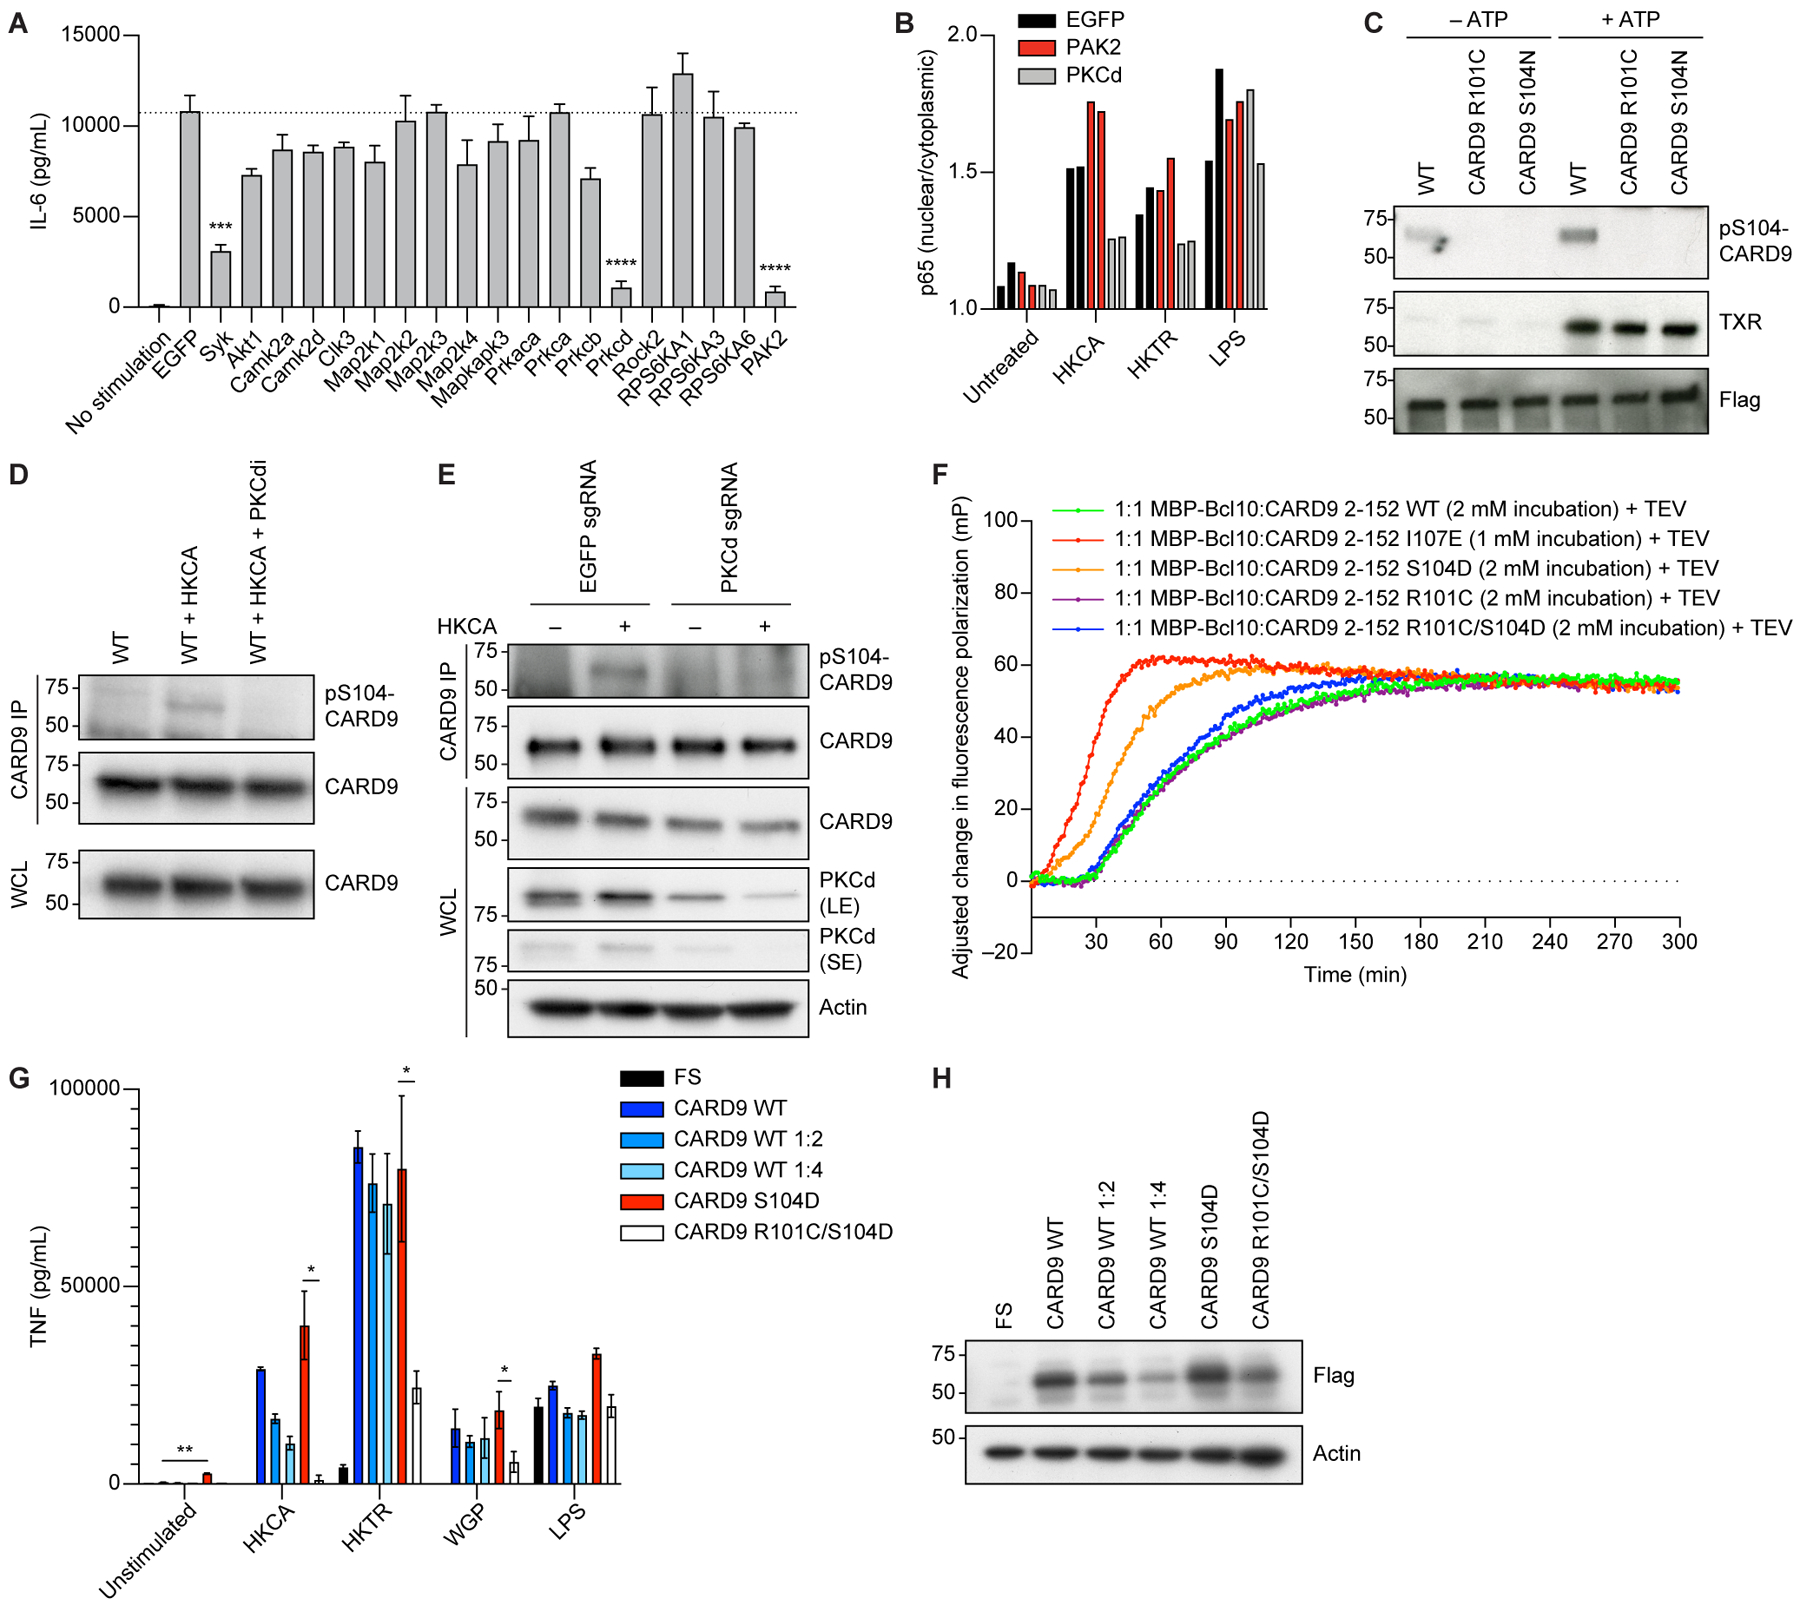
Figure 3. CARD9 R101 functions as a signaling switch activated by S104 phosphorylation.

A, BMDCs expressing Cas9 were transduced with guides for the corresponding genes on day 2 and selected with puromycin. On day 9, cells were stimulated with 100 μg/ml WGP overnight, and Il-6 concentrations in the supernatant were measured with ELISA. B, BMDCs expressing Cas9 were transduced with guides for the corresponding genes on day 2 and selected with puromycin. On day 9, cells were stimulated with HKCA (MOI 1:10), HKTR (1:10), or LPS (10 ng/ml) for 30 min. p65 nuclear translocation was measured using fluorescence imaging. C, CARD9 WT, CARD9 R101C, or CARD9 S104N were overexpressed in HEK 293T cells. Following anti-flag pull-down, beads were incubated with purified PKCδ in the presence or absence of ATP and processed for western blotting with the indicated antibodies. D, WT BMDCs were treated with HKCA (MOI 1:10) or HKCA (MOI 1:10) plus the PKCδ inhibitor sotrastaurin (PKCdi) for 30 min and processed for immunoprecipitation with an anti-Card9 antibody. Samples were analyzed by western blot with the indicated antibodies. E, Control or Pkcδ KO BMDCs were treated with HKCA (MOI 1:10) for 30 min and processed for immunoprecipitation with an anti-Card9 antibody. Samples were analyzed by western blot with the indicated antibodies. LE, long exposure; SE, short exposure. F, Normalized fluorescence polarization representing filament formation between different CARD9 2–152 variants and maltose binding protein (MBP)-tagged BCL10 (average of quadruplicates). G, Tnf concentration in the supernatant from Card9−/− BMDCs transduced with lentiviruses containing either empty vector (FS), CARD9 WT, CARD9 WT diluted 1:2, CARD9 WT diluted 1:4, CARD9 S104D, or CARD9 R101C/S104D and stimulated with HKCA (MOI 1:10), HKTR (MOI 1:10), WGP (50 μg/ml), or LPS (10 ng/ml) for 24 h. H, Expression of CARD9 in the lysates from panel G determined by western blot with the indicated antibodies. In C-E and H, molecular weight markers (kDa) are shown to the left; IP, immunoprecipitate; WCL, whole cell lysate. Each experiment was repeated 3 times. Data represent mean +/− SEM. *p<0.05, **p<0.01, *** p < 0.001, **** p < 0.0001 from paired t-tests. See also Figure S2.
