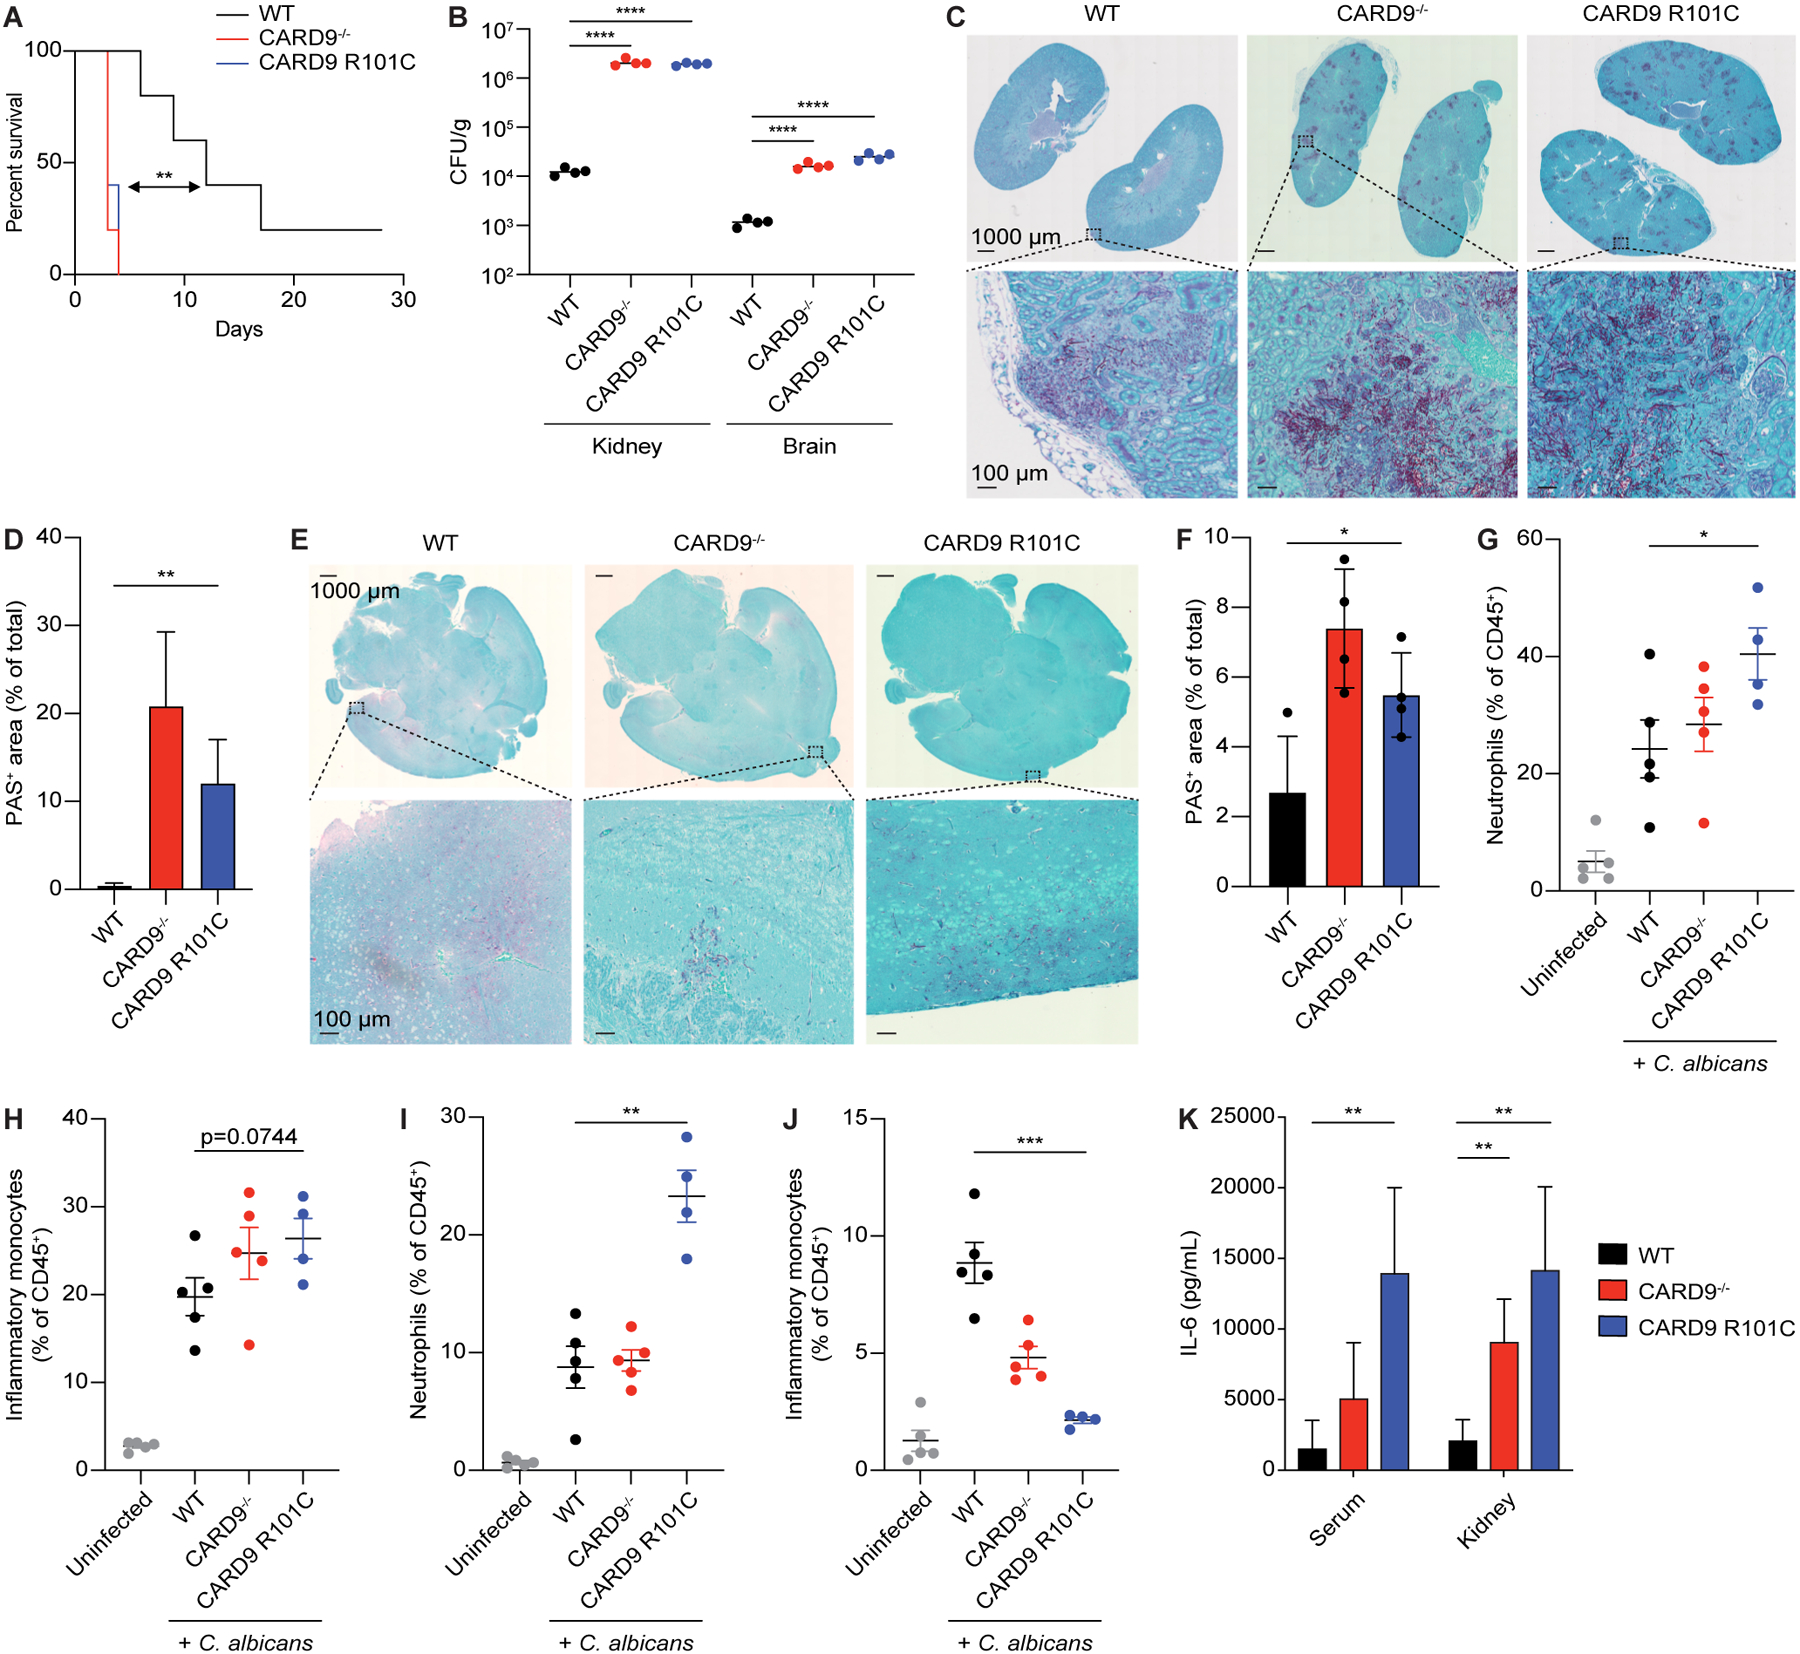
Figure 4. Card9 R101C mice are predisposed to systemic fungal infection.

A, Survivorship over time of mice injected intravenously with live C. albicans (n=10 for each genotype). B, Colony forming units (CFUs) from the kidneys or brains of mice injected intravenously with live C. albicans analyzed on D2 post-infection (n=4 for each genotype). C, Representative PAS staining of kidneys from mice in panel B. D, Quantification of panel C. E, Representative PAS staining of brains from mice in panel B. F, Quantification of panel E. G-H, Flow cytometry analysis of G, neutrophil composition and H, inflammatory monocytes in the kidneys from mice in panel B. I-J, Flow cytometry analysis of I, neutrophil composition and J, inflammatory monocytes in the brains from mice in panel B. K, IL-6 concentrations in the serum and kidney from mice in panel B. Each experiment was repeated at least 2 times. Data represent mean +/− SEM. *p<0.05, **p<0.01,***p<0.001, ****p<0.0001 from paired t-tests. Scale bars represent 1000 μm or 100 μm. See also Figure S3.
