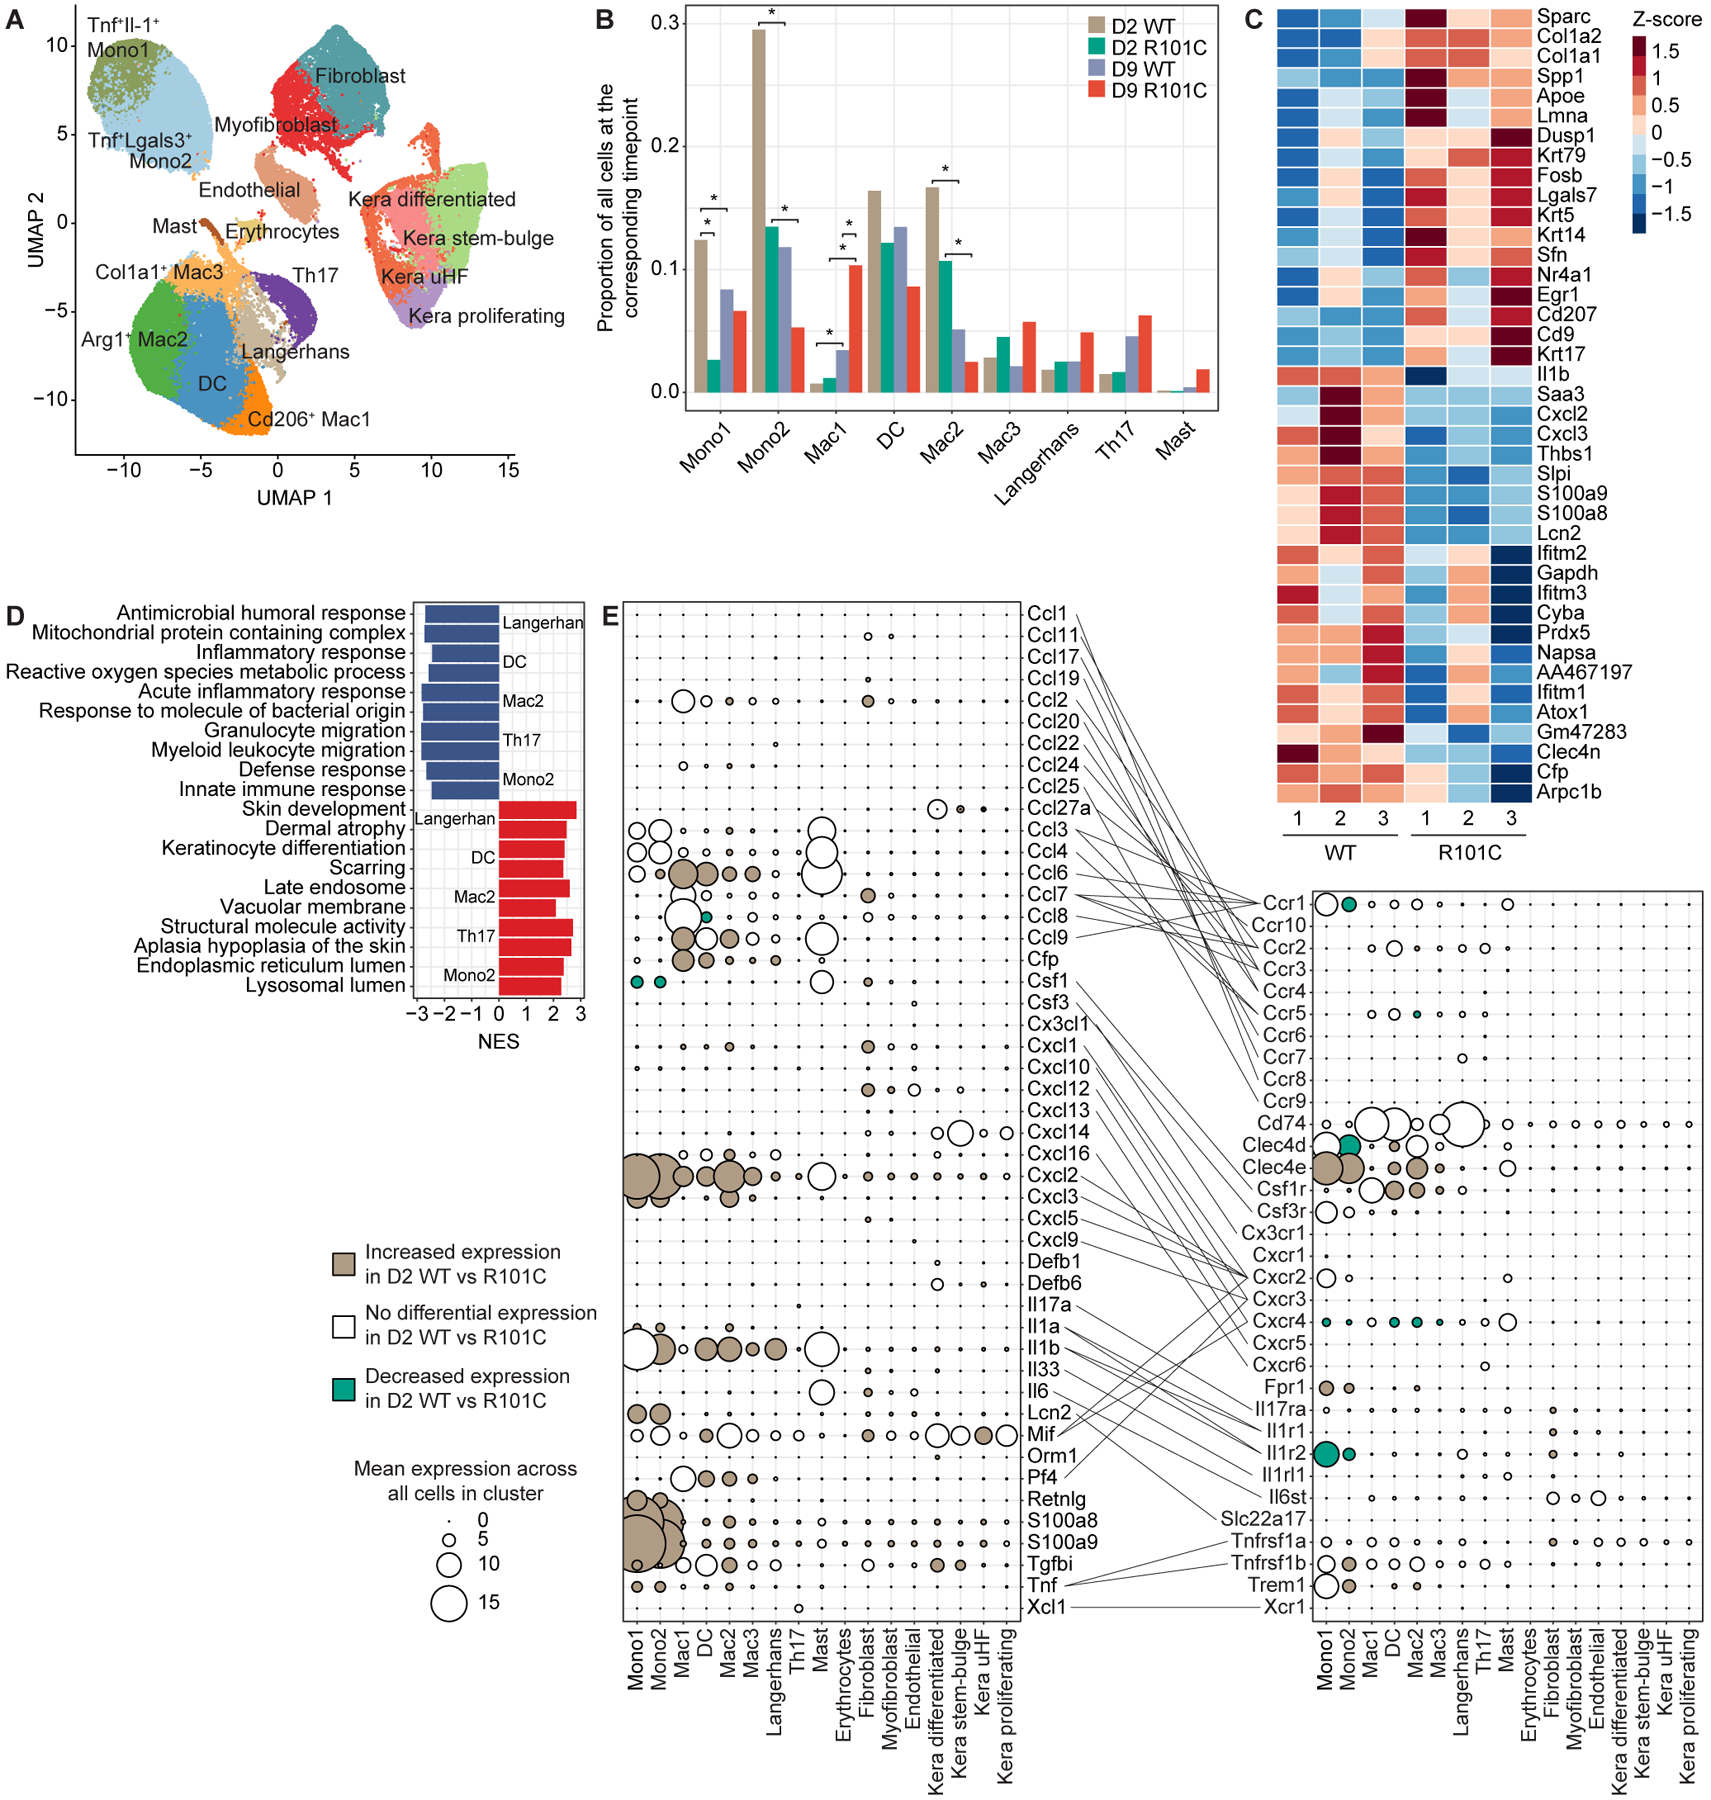
Figure 6. Card9 R101C impairs inflammatory signaling pathways and cell–cell communication circuitry in skin immune, stromal, and keratinocyte clusters.

A, Clustering of cells based on expression obtained after scRNA-seq of Card9 WT and Card9 R101C skin analyzed on D2 and D9 post-infection with T. rubrum. n=6 for WT and n=6 for R101C (3 replicates of each WT and R101C at each timepoint). B, Prevalence of each immune cluster across Card9 genotypes and timepoints. Bar plots show the mean prevalence of each cluster across 3 replicates. For each cluster, 4 comparisons were conducted: D2 WT vs D2 R101C; D9 WT vs D9 R101C; D2 WT vs D9 WT; D2 R01C vs D9 R101C. Comparisons were conducted using Dirichlet multinomial regression and corrected for multiple testing using the Benjamini-Hochberg method. *FDR p < 0.05. C, Top 20 significant (FDR P < 0.05) DEGs between D2 WT and D2 R101C cells within the Langerhans cell cluster. D, Top pathways enriched in immune clusters based on DEGs between D2 WT cells and D2 R101C cells within each cluster. NES indicates normalized enrichment score from GSEA using DEGs between D2 WT cells and D2 R101C cells within each cluster; NES < 0 indicates upregulated in WT, NES > 0 indicates upregulated in R101C. E, Mean expression of cytokines, chemokines, effector molecules (left dot plot), and their corresponding receptors (right dot plot) in each cluster. Lines connect ligands to cognate receptors. For each molecule, the mean expression across all cells in each cluster regardless of Card9 genotype is shown. Increasing dot size indicates higher expression of the marker in the corresponding cluster. Colors indicate whether the molecule is significantly upregulated in D2 WT vs R101C cells in the corresponding cluster (beige), D2 R101C vs WT cells in the corresponding cluster (green), or not differentially expressed between D2 WT and R101C cells in the corresponding cluster (white). See also Figures S5 and S6 and Tables S1–S4.
